Here - Tilburg University
Here - Tilburg University
Here - Tilburg University

You also want an ePaper? Increase the reach of your titles
YUMPU automatically turns print PDFs into web optimized ePapers that Google loves.
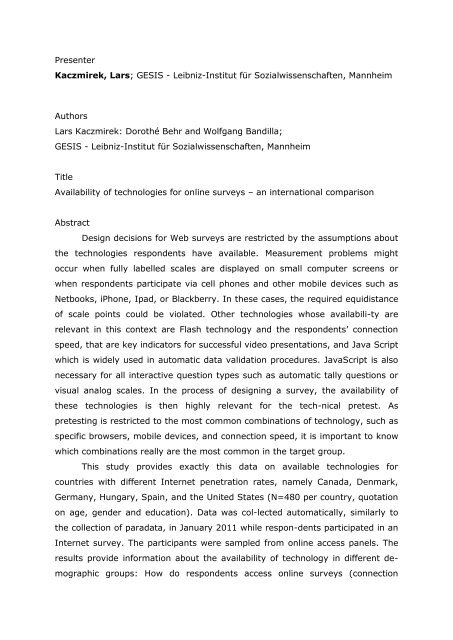
Presenter<br />
Kaczmirek, Lars; GESIS - Leibniz-Institut für Sozialwissenschaften, Mannheim<br />
Authors<br />
Lars Kaczmirek: Dorothé Behr and Wolfgang Bandilla;<br />
GESIS - Leibniz-Institut für Sozialwissenschaften, Mannheim<br />
Title<br />
Availability of technologies for online surveys – an international comparison<br />
Abstract<br />
Design decisions for Web surveys are restricted by the assumptions about<br />
the technologies respondents have available. Measurement problems might<br />
occur when fully labelled scales are displayed on small computer screens or<br />
when respondents participate via cell phones and other mobile devices such as<br />
Netbooks, iPhone, Ipad, or Blackberry. In these cases, the required equidistance<br />
of scale points could be violated. Other technologies whose availabili-ty are<br />
relevant in this context are Flash technology and the respondents’ connection<br />
speed, that are key indicators for successful video presentations, and Java Script<br />
which is widely used in automatic data validation procedures. JavaScript is also<br />
necessary for all interactive question types such as automatic tally questions or<br />
visual analog scales. In the process of designing a survey, the availability of<br />
these technologies is then highly relevant for the tech-nical pretest. As<br />
pretesting is restricted to the most common combinations of technology, such as<br />
specific browsers, mobile devices, and connection speed, it is important to know<br />
which combinations really are the most common in the target group.<br />
This study provides exactly this data on available technologies for<br />
countries with different Internet penetration rates, namely Canada, Denmark,<br />
Germany, Hungary, Spain, and the United States (N=480 per country, quotation<br />
on age, gender and education). Data was col-lected automatically, similarly to<br />
the collection of paradata, in January 2011 while respon-dents participated in an<br />
Internet survey. The participants were sampled from online access panels. The<br />
results provide information about the availability of technology in different de-<br />
mographic groups: How do respondents access online surveys (connection