Informe de gestión - Ohl
Informe de gestión - Ohl
Informe de gestión - Ohl

Create successful ePaper yourself
Turn your PDF publications into a flip-book with our unique Google optimized e-Paper software.
206<br />
>> Obrascón Huarte Lain, S.A. y socieda<strong>de</strong>s <strong>de</strong>pendientes<br />
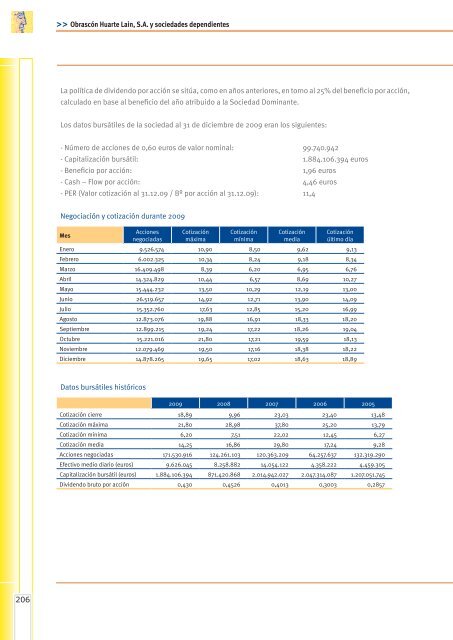
La política <strong>de</strong> divi<strong>de</strong>ndo por acción se sitúa, como en años anteriores, en torno al 25% <strong>de</strong>l beneficio por acción,<br />
calculado en base al beneficio <strong>de</strong>l año atribuido a la Sociedad Dominante.<br />
Los datos bursátiles <strong>de</strong> la sociedad al 31 <strong>de</strong> diciembre <strong>de</strong> 2009 eran los siguientes:<br />
- Número <strong>de</strong> acciones <strong>de</strong> 0,60 euros <strong>de</strong> valor nominal: 99.740.942<br />
- Capitalización bursátil: 1.884.106.394 euros<br />
- Beneficio por acción: 1,96 euros<br />
- Cash – Flow por acción: 4,46 euros<br />
- PER (Valor cotización al 31.12.09 / Bº por acción al 31.12.09): 11,4<br />
Negociación y cotización durante 2009<br />
Mes<br />
Datos bursátiles históricos<br />
Acciones<br />
negociadas<br />
Cotización<br />
máxima<br />
Cotización<br />
mínima<br />
Cotización<br />
media<br />
Cotización<br />
último día<br />
Enero 9.526.574 10,90 8,50 9,62 9,13<br />
Febrero 6.002.325 10,34 8,24 9,18 8,34<br />
Marzo 16.409.498 8,39 6,20 6,95 6,76<br />
Abril 14.324.829 10,44 6,57 8,69 10,27<br />
Mayo 15.444.232 13,50 10,29 12,19 13,00<br />
Junio 26.519.657 14,92 12,71 13,90 14,09<br />
Julio 15.352.760 17,63 12,85 15,20 16,99<br />
Agosto 12.873.076 19,88 16,91 18,33 18,20<br />
Septiembre 12.899.215 19,24 17,22 18,26 19,04<br />
Octubre 15.221.016 21,80 17,21 19,59 18,13<br />
Noviembre 12.079.469 19,50 17,16 18,38 18,22<br />
Diciembre 14.878.265 19,65 17,02 18,63 18,89<br />
2009 2008 2007 2006 2005<br />
Cotización cierre 18,89 9,96 23,03 23,40 13,48<br />
Cotización máxima 21,80 28,98 37,80 25,20 13,79<br />
Cotización mínima 6,20 7,51 22,02 12,45 6,27<br />
Cotización media 14,25 16,86 29,80 17,24 9,28<br />
Acciones negociadas 171.530.916 124.261.103 120.363.209 64.257.637 132.319.290<br />
Efectivo medio diario (euros) 9.626.045 8.258.882 14.054.122 4.358.222 4.459.305<br />
Capitalización bursátil (euros) 1.884.106.394 871.420.868 2.014.942.027 2.047.314.087 1.207.051.745<br />
Divi<strong>de</strong>ndo bruto por acción 0,430 0,4526 0,4013 0,3003 0,2857