cartographie de la pollution atmosphérique en milieu urbain à l'aide ...
cartographie de la pollution atmosphérique en milieu urbain à l'aide ...
cartographie de la pollution atmosphérique en milieu urbain à l'aide ...

You also want an ePaper? Increase the reach of your titles
YUMPU automatically turns print PDFs into web optimized ePapers that Google loves.
54<br />
Chapitre 5 : Caractérisation <strong>de</strong> <strong>la</strong> ville – construction <strong>de</strong>s cartes d’i<strong>de</strong>ntité<br />
Remarque : les <strong>de</strong>ux autres paramètres utilisés pour le calcul <strong>de</strong>s surfaces <strong>de</strong> visibilités (nombre <strong>de</strong><br />
rayons et distance maximum) sont pris a priori suffisamm<strong>en</strong>t grands afin <strong>de</strong> minimiser leur influ<strong>en</strong>ce<br />
sur le calcul : Nrayons = 360 et Dmax= 300 m.<br />
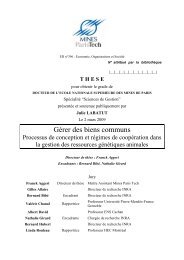
a) b) c)<br />
d) e)<br />
Figure 5.7 : Calcul <strong>de</strong> <strong>la</strong> surface <strong>de</strong> visibilité a) station STG C<strong>en</strong>tre <strong>de</strong> Strasbourg ;<br />
b) <strong>la</strong>ncem<strong>en</strong>t d’un rayon ;<br />
c) calcul <strong>de</strong> <strong>la</strong> portion <strong>de</strong> surface correspondante ;<br />
d) calcul <strong>de</strong>s portions dans toutes les directions ;<br />
e) somme <strong>de</strong>s portions : échantillonnage angu<strong>la</strong>ire.<br />
Zoom<br />
Figure 5.8 : zone c<strong>en</strong>trée sur <strong>la</strong> station STG C<strong>en</strong>tre (sur <strong>la</strong> p<strong>la</strong>ce Kléber, point rouge : 998 748, 1 112<br />
359). Maille <strong>en</strong> bleu : x ε [998 743 ; 998 753] et y ε [1 112 354 ; 1 112 364]