L’État de la sécurité alimentaire et de la nutrition dans le monde 2017
L’État de la sécurité alimentaire et de la nutrition dans le monde 2017.
L’État de la sécurité alimentaire et de la nutrition dans le monde 2017.

You also want an ePaper? Increase the reach of your titles
YUMPU automatically turns print PDFs into web optimized ePapers that Google loves.
PARTIE 1 LA SÉCURITÉ ALIMENTAIRE ET LA NUTRITION DANS LE MONDE EN <strong>2017</strong><br />
ENCADRÉ 3<br />
(SUITE)<br />
<strong>de</strong>s données autres que <strong>le</strong>s sources statistiques nationa<strong>le</strong>s<br />
officiel<strong>le</strong>s sont utilisées pour <strong>le</strong> suivi <strong>de</strong>s ODD, el<strong>le</strong>s seront<br />
examinées <strong>et</strong> convenues par <strong>le</strong>s autorités statistiques<br />
nationa<strong>le</strong>s <strong>et</strong> présentées <strong>de</strong> façon transparente<br />
(UNSC48/101/l), <strong>la</strong> FAO a procédé à une consultation<br />
afin <strong>de</strong> <strong>de</strong>man<strong>de</strong>r l’approbation <strong>de</strong>s offices nationaux <strong>de</strong><br />
statistique pour <strong>la</strong> publication <strong>de</strong>s estimations re<strong>la</strong>tives à<br />
<strong>le</strong>ur pays. Ne figurent <strong>dans</strong> <strong>le</strong> présent rapport que <strong>le</strong>s<br />
estimations <strong>de</strong>s pays ayant donné <strong>le</strong>ur approbation avant<br />
<strong>la</strong> publication.<br />
1<br />
J. Coates, E.A. Frongillo, B. Lorge Rogers, P. Webb, P.E. Wil<strong>de</strong> <strong>et</strong> R. Houser.<br />
2006. «Commonalities in the experience of household food insecurity across<br />
cultures: what are measures missing?» Journal of Nutrition, 136:<br />
1420S–1430S.<br />
2<br />
FAO. 2016. Métho<strong>de</strong>s d’estimation <strong>de</strong> taux comparab<strong>le</strong>s <strong>de</strong> préva<strong>le</strong>nce <strong>de</strong> l’insécurité<br />
<strong>alimentaire</strong> chez <strong>le</strong>s adultes à l’échel<strong>le</strong> mondia<strong>le</strong>. Rome.<br />
3<br />
Le fait que <strong>le</strong> pourcentage <strong>de</strong>s personnes victimes d’insécurité <strong>alimentaire</strong> modérée<br />
uniquement ne constitue pas un indicateur <strong>de</strong> suivi global s’explique par <strong>le</strong> fait qu’une<br />
modification <strong>de</strong> ce pourcentage pourrait conduire à une interprétation ambiguë: une<br />
réduction pourrait être due au passage <strong>de</strong> certaines personnes victimes d’insécurité<br />
<strong>alimentaire</strong> modérée <strong>dans</strong> <strong>la</strong> catégorie «grave». Le regroupement <strong>de</strong>s catégories<br />
d’insécurité <strong>alimentaire</strong> modérée <strong>et</strong> grave évite <strong>de</strong> tel<strong>le</strong>s ambiguïtés.<br />
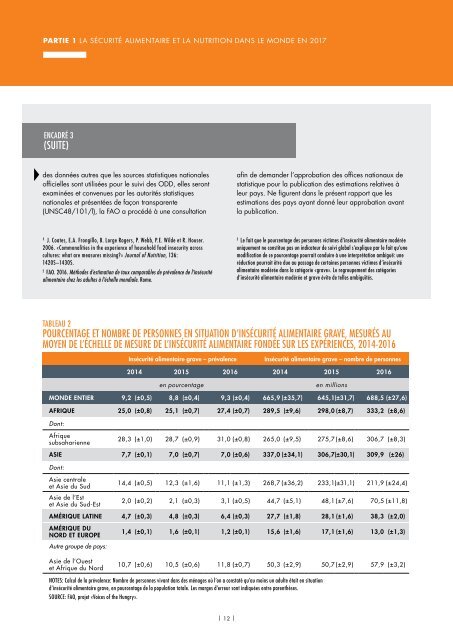
TABLEAU 2<br />
POURCENTAGE ET NOMBRE DE PERSONNES EN SITUATION D’INSÉCURITÉ ALIMENTAIRE GRAVE, MESURÉS AU<br />
MOYEN DE L’ÉCHELLE DE MESURE DE L’INSÉCURITÉ ALIMENTAIRE FONDÉE SUR LES EXPÉRIENCES, 2014-2016<br />
Insécurité <strong>alimentaire</strong> grave – préva<strong>le</strong>nce Insécurité <strong>alimentaire</strong> grave – nombre <strong>de</strong> personnes<br />
2014 2015 2016 2014 2015 2016<br />
en pourcentage en millions<br />
MONDE ENTIER 9,2 (±0,5) 8,8 (±0,4) 9,3 (±0,4) 665,9 (±35,7) 645,1(±31,7) 688,5 (±27,6)<br />
AFRIQUE 25,0 (±0,8) 25,1 (±0,7) 27,4 (±0,7) 289,5 (±9,6) 298,0 (±8,7) 333,2 (±8,6)<br />
Dont:<br />
Afrique<br />
subsaharienne<br />
28,3 (±1,0) 28,7 (±0,9) 31,0 (±0,8) 265,0 (±9,5) 275,7 (±8,6) 306,7 (±8,3)<br />
ASIE 7,7 (±0,1) 7,0 (±0,7) 7,0 (±0,6) 337,0 (±34,1) 306,7(±30,1) 309,9 (±26)<br />
Dont:<br />
Asie centra<strong>le</strong><br />
<strong>et</strong> Asie du Sud<br />
Asie <strong>de</strong> l’Est<br />
<strong>et</strong> Asie du Sud-Est<br />
14,4 (±0,5) 12,3 (±1,6) 11,1 (±1,3) 268,7 (±36,2) 233,1(±31,1) 211,9 (±24,4)<br />
2,0 (±0,2) 2,1 (±0,3) 3,1 (±0,5) 44,7 (±5,1) 48,1 (±7,6) 70,5 (±11,8)<br />
AMÉRIQUE LATINE 4,7 (±0,3) 4,8 (±0,3) 6,4 (±0,3) 27,7 (±1,8) 28,1 (±1,6) 38,3 (±2,0)<br />
AMÉRIQUE DU<br />
NORD ET EUROPE<br />
1,4 (±0,1) 1,6 (±0,1) 1,2 (±0,1) 15,6 (±1,6) 17,1 (±1,6) 13,0 (±1,3)<br />
Autre groupe <strong>de</strong> pays:<br />
Asie <strong>de</strong> l’Ouest<br />
<strong>et</strong> Afrique du Nord<br />
10,7 (±0,6) 10,5 (±0,6) 11,8 (±0,7) 50,3 (±2,9) 50,7 (±2,9) 57,9 (±3,2)<br />
NOTES: Calcul <strong>de</strong> <strong>la</strong> préva<strong>le</strong>nce: Nombre <strong>de</strong> personnes vivant <strong>dans</strong> <strong>de</strong>s ménages où l’on a constaté qu’au moins un adulte était en situation<br />
d’insécurité <strong>alimentaire</strong> grave, en pourcentage <strong>de</strong> <strong>la</strong> popu<strong>la</strong>tion tota<strong>le</strong>. Les marges d’erreur sont indiquées entre parenthèses.<br />
SOURCE: FAO, proj<strong>et</strong> «Voices of the Hungry».<br />
| 12 |