L’État de la sécurité alimentaire et de la nutrition dans le monde 2017
L’État de la sécurité alimentaire et de la nutrition dans le monde 2017.
L’État de la sécurité alimentaire et de la nutrition dans le monde 2017.

Create successful ePaper yourself
Turn your PDF publications into a flip-book with our unique Google optimized e-Paper software.
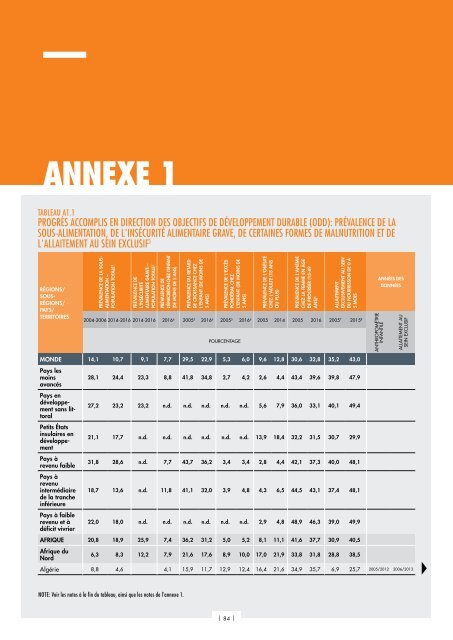
ANNEXE 1<br />
TABLEAU A1.1<br />
PROGRÈS ACCOMPLIS EN DIRECTION DES OBJECTIFS DE DÉVELOPPEMENT DURABLE (ODD): PRÉVALENCE DE LA<br />
SOUS-ALIMENTATION, DE L'INSÉCURITÉ ALIMENTAIRE GRAVE, DE CERTAINES FORMES DE MALNUTRITION ET DE<br />
L'ALLAITEMENT AU SEIN EXCLUSIF 1<br />
RÉGIONS/<br />
SOUS-<br />
RÉGIONS/<br />
PAYS/<br />
TERRITOIRES<br />
PRÉVALENCE DE LA SOUS-<br />
ALIMENTATION –<br />
POPULATION TOTALE 2<br />
PRÉVALENCE DE<br />
L'INSÉCURITÉ<br />
ALIMENTAIRE GRAVE –<br />
POPULATION TOTALE 3<br />
PRÉVALENCE DE<br />
L'ÉMACIATION CHEZ L'ENFANT<br />
(DE MOINS DE 5 ANS)<br />
PRÉVALENCE DU RETARD<br />
DE CROISSANCE CHEZ<br />
L'ENFANT (DE MOINS DE<br />
5 ANS)<br />
PRÉVALENCE DE L'EXCÈS<br />
PONDÉRAL CHEZ<br />
L'ENFANT (DE MOINS DE<br />
5 ANS)<br />
PRÉVALENCE DE L'OBÉSITÉ<br />
CHEZ L'ADULTE (18 ANS<br />
OU PLUS)<br />
PRÉVALENCE DE L'ANÉMIE<br />
CHEZ LA FEMME EN ÂGE<br />
DE PROCRÉER (15-49<br />
ANS) 4<br />
ALLAITEMENT<br />
EXCLUSIVEMENT AU SEIN<br />
DU NOURRISSON DE 0 À<br />
5 MOIS<br />
2004-2006 2014-2016 2014-2016 2016 6 2005 5 2016 6 2005 5 2016 6 2005 2014 2005 2016 2005 7 2015 8<br />
POURCENTAGE<br />
ANNÉES DES<br />
DONNÉES<br />
ANTHROPOMÉTRIE<br />
INFANTILE<br />
ALLAITEMENT AU<br />
SEIN EXCLUSIF<br />
MONDE 14,1 10,7 9,1 7,7 29,5 22,9 5,3 6,0 9,6 12,8 30,6 32,8 35,2 43,0<br />
Pays <strong>le</strong>s<br />
moins<br />
avancés<br />
Pays en<br />
développement<br />
sans littoral<br />
P<strong>et</strong>its États<br />
insu<strong>la</strong>ires en<br />
développement<br />
Pays à<br />
revenu faib<strong>le</strong><br />
Pays à<br />
revenu<br />
intermédiaire<br />
<strong>de</strong> <strong>la</strong> tranche<br />
inférieure<br />
Pays à faib<strong>le</strong><br />
revenu <strong>et</strong> à<br />
déficit vivrier<br />
28,1 24,4 23,3 8,8 41,8 34,8 2,7 4,2 2,6 4,4 43,4 39,6 39,8 47,9<br />
27,2 23,2 23,2 n.d. n.d. n.d. n.d. n.d. 5,6 7,9 36,0 33,1 40,1 49,4<br />
21,1 17,7 n.d. n.d. n.d. n.d. n.d. n.d. 13,9 18,4 32,2 31,5 30,7 29,9<br />
31,8 28,6 n.d. 7,7 43,7 36,2 3,4 3,4 2,8 4,4 42,1 37,3 40,0 48,1<br />
18,7 13,6 n.d. 11,8 41,1 32,0 3,9 4,8 4,3 6,5 44,5 43,1 37,4 48,1<br />
22,0 18,0 n.d. n.d. n.d. n.d. n.d. n.d. 2,9 4,8 48,9 46,3 39,0 49,9<br />
AFRIQUE 20,8 18,9 25,9 7,4 36,2 31,2 5,0 5,2 8,1 11,1 41,6 37,7 30,9 40,5<br />
Afrique du<br />
Nord<br />
6,3 8,3 12,2 7,9 21,6 17,6 8,9 10,0 17,0 21,9 33,8 31,8 28,8 38,5<br />
Algérie 8,8 4,6 4,1 15,9 11,7 12,9 12,4 16,4 21,6 34,9 35,7 6,9 25,7 2005/2012 2006/2013<br />
NOTE: Voir <strong>le</strong>s notes à <strong>la</strong> fin du tab<strong>le</strong>au, ainsi que <strong>le</strong>s notes <strong>de</strong> l'annexe 1.<br />
| 84 |