

download pdf - Vlaams Instituut voor de Zee
download pdf - Vlaams Instituut voor de Zee
download pdf - Vlaams Instituut voor de Zee

Create successful ePaper yourself
Turn your PDF publications into a flip-book with our unique Google optimized e-Paper software.
in VTE<br />
Totaal <strong>Vlaams</strong>e havens - Werkgelegenheid (VTE)<br />
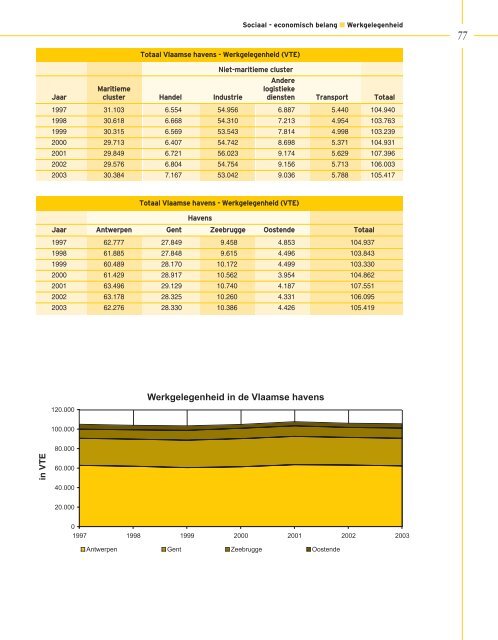
Sociaal - economisch belang ■ Werkgelegenheid<br />
Niet-maritieme cluster<br />
An<strong>de</strong>re<br />
Maritieme logistieke<br />
Jaar cluster Han<strong>de</strong>l Industrie diensten Transport Totaal<br />
1997 31.103 6.554 54.956 6.887 5.440 104.940<br />
1998 30.618 6.668 54.310 7.213 4.954 103.763<br />
1999 30.315 6.569 53.543 7.814 4.998 103.239<br />
2000 29.713 6.407 54.742 8.698 5.371 104.931<br />
2001 29.849 6.721 56.023 9.174 5.629 107.396<br />
2002 29.576 6.804 54.754 9.156 5.713 106.003<br />
2003 30.384 7.167 53.042 9.036 5.788 105.417<br />
Totaal <strong>Vlaams</strong>e havens - Werkgelegenheid (VTE)<br />
Havens<br />
Jaar Antwerpen Gent <strong>Zee</strong>brugge Oosten<strong>de</strong> Totaal<br />
1997 62.777 27.849 9.458 4.853 104.937<br />
1998 61.885 27.848 9.615 4.496 103.843<br />
1999 60.489 28.170 10.172 4.499 103.330<br />
2000 61.429 28.917 10.562 3.954 104.862<br />
2001 63.496 29.129 10.740 4.187 107.551<br />
2002 63.178 28.325 10.260 4.331 106.095<br />
2003 62.276 28.330 10.386 4.426 105.419<br />
120.000<br />
100.000<br />
80.000<br />
60.000<br />
40.000<br />
20.000<br />
Werkgelegenheid in <strong>de</strong> <strong>Vlaams</strong>e havens<br />
0<br />
1997 1998 1999 2000 2001 2002 2003<br />
Antwerpen Gent <strong>Zee</strong>brugge Oosten<strong>de</strong><br />
77


