22 Tabell 30. Dødelighet i 1. leveår Infant mortality rams Døde under 1 Sr Deaths under 1 year of age Døde under 1 Sr pr. 1 000 levendefødte Deaths under 1 year of age per 1 000 live births Åt' Year' I alt Gutter Piker I alt Total Males Females Total Under 4 uker' ¢Unde ' 4 uker- Fødte Fødte 11 mndr.a i ekteskap utenfo 4 weeks- ekteskap Legitimate Illegiti- 11 months' births mate births 1916-20 3 931 2 235 1 696 62,2 25,8 36,4 ' 59,2 97,9 1921-25 3 115 1 756 1 359 51,7 22,1 29,6 49,4 82,8 1926-30 2 479 1 425 1 054 49,5 24,5 25,0 47,2 80,5 1931-35 1946 1 127 819 44,9 22,5 22,4 42,5 76,8 1936-40 1 779 1 029 750 39,4 21,3 18,1 37,4 68,8 1941-45 2 088 1 177 911 37,3 18,4 18,8 34,5 71,2 1946-50 2 048 1 200 848 31,1 16,0 15,0 29,4 63,7 1951-55 1 415 814 601 22,6 13,1 9,6 21,7 46,9 1956-60 1 251 721 530 19,9 12,4 7,4 19,2 37,2 1961-65 1 096 633 463 17,1 12,0 5,1 16,7 26,8 1960 1167 671 496 18,9 11,7 7,2 18,5 29,4 1961 1117 656 461 17,9 12,3 5,6 17,4 29,9 1962 1104 656 448 17,7 12,0 5,7 17,6 21,8 1963 1 068 605 463 16,9 11,9 5,0 16,5 25,9 1964 1 078 612 466 16,4 11,8 4,6 16,0 26,8 1965 1 113 637 476 16,8 11,9 4,8 16,2 28,8 1966 976 568 408 14,5 10,2 4,3 14,3 20,1 1967 985 563 422 14,8 11,1 3,6 14,5 19,3 1968 923 520 403 13,7 10,1 3,6 13,4 18,3 Kilde: NOS Folkemengdens bevegelse. Source: NOS Vital Statistics and Migration Statistics. Noter: 1 Årsgjennomsnitt for femårsperioden. ' Far 1951, under 1 måned. a For 1951, 1-11 måneder. Notes: 1 Annual average for the five-year period. ' Before 1951, under 1 month. ' Before 1951, 1-11 months. Tabell 31. Dødelighet i 1. leveår etter fylke Infant mortality rates by county Fylke County 1916- 1920 1921- 1925 1926- 1930 Døde under 1 år pr. 1 000 levendefødte Deaths under 1 year of age per 1 000 live births 1931- 1935 1936- 1940 1941- 1945 1946- 1950 1951- 1955 I 1956- I 1960 Hele landet The whole country 62,2 51,7 49,5 44,9 39,4 37,3 31,1 22,6 19,9 17,1 1961- 1965 Bykomm. Urban municip. 73,4 58,3 54,1 48,7 38,7 34,5 29,6 20,3 18,7 16,3 Herredskomm. Rural municip. 57,7 49,6 48,3 44,0 39,6 38,1 31,5 23,5 20,3 17,5 Østfold 66,3 58,7 64,3 51,9 48,9 36,5 33,3 20,4 20,3 19,9 Akershus 54,7 46,2 46,1 42,6 30,1 32,2 25,2 17,8 17,9 15,2 Oslo 73,4 52,7 47,2 37,3 30,4 31,0 23,4 18,0 16,7 14,8 Hedmark 58,5 47,9 48,5 43,7 40,5 36,7 32,1 21,6 20,3 18,8 Oppland 49,0 44,6 41,0 38,0 31,8 36,2 25,5 21,5 18,5 15,6 Buskerud 61,7 53,8 48,9 43,4 36,6 38,3 27,7 20,8 20,2 15,0 Vestfold 64,6 56,3 48,0 51,3 38,4 35,2 27,0 20,9 18,0 19,0 Telemark 61,3 56,9 55,7 52,0 38,5 32,1 31,3 20,7 22,1 17,9 Aust-Agder 54,0 42,9 55,4 45,8 36,8 41,3 30,7 21,7 20,2 19,7 Vest-Agder 52,1 48,0 44,9 40,5 39,8 47,3 34,1 24,8 21,2 19,3 Rogaland 63,0 51,6 48,5 48,5 45,4 39,2 36,3 21,5 20,3 15,2 Hordaland 52,6 45,0 39,4 38,7 33,8 31,9 27,1 20,8 17,5 13,5 Bergen 62,7 44,8 46,2 40,3 31,3 29,8 25,4 16,4 16,0 12,3 Sogn og Fjordane 46,9 41,5 36,1 31,0 33,8 26,2 24,7 23,1 19,3 15,3 Møre og Romsdal 54,2 43,9 40,6 36,3 34,9 33,6 30,3 23,3 17,7 15,5 Sør-Trøndelag . . 63,4 50,4 48,6 43,3 36,0 35,1 28,9 22,9 19,6 17,6 Nord-Trøndelag 50,2 42,7 41,5 38,4 42,8 33,8 32,2 23,5 17,1 16,5 Nordland 62,8 53,5 51,4 42,8 44,2 40,4 37,0 28,9 23,7 22,5 Troms 81,2 66,4 67,2 62,4 51,2 54,3 46,4 31,6 28,0 21,8 Finnmark 127,7 111,9 91,7 92,0 75,1 83,8 57,1 42,3 32,3 24,6 Kilde: NOS Folkemengdene bevegelse. Source: NOS Vital Statistics and Migration Statistics.
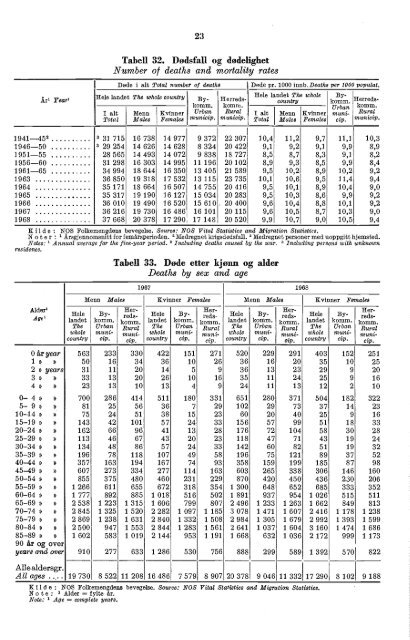
23 Tabell 32. Dødsfall og dødelighet Number of deaths and mortality rates ' År Year' Døde i alt Total number of deaths Døde pr. 1000 innb. Deaths per 1000 populat. Hele landet The whole country Hele landet The whole Bykomen. B y- Herreds- country Herredskomm. loom si. Urban komen. I alt Menn Kvinner Urban Rural I alt Menn Kvinner muni- Rural Total Males Females munecip. munxcxp. Total Males Females cip. munzcxp, 1941-452 3 31 715 16 738 14 977 9 372 22 307 10,4 11,2 9,7 11,1 10,3 1946-50 3 29 254 14 626 14 628 8 324 20 422 9,1 9,2 9,1 9,9 8,9 1951-55 28 565 14 493 14 072 9 838 18 727 8,5 8,7 8,3 9,1 8,2 1956-60 31 298 16 303 14 995 11 196 20 102 8,9 9,3 8,5 9,9 8,4 1961-65 .. 34 994 18 644 16 350 13 405 21 589 9,5 10,2 8,9 10,2 9,2 1963 36 850 19 318 17 532 13 115 23 735 10,1 10,6 9,5 11,4 9,4 1964 35 171 18 664 16 507 14 755 20 416 9,5 10,1 8,9 10,4 9,0 1965 35 317 19 190 16 127 15 034 20 283 9,5 10,3 8,6 9,9 9,2 1966 36 010 19 490 16 520 15 610 , 20 400 9,6 10,4 8,8 10,1 9,2 1967 36 216 19 730 16 486 16 101 20 115 9,6 10,5 8,7 10,3 9,0 1968 37 668 20 378 17 290 17 148 20 520 9,9 10,7 9,0 10,5 9,4 Kilde : NOS Folkemengdens bevegelse. Source: NOS Vital Statistics and Migration Statistics. Not er : Årsgjennomsnitt for femårsperioden. ' Medregnet krigsdødsf all. ' Medregnet personer med uoppgitt hjemsted. Notes: 3 Annual average for the five-year period. Including deaths caused by the war. ' Including persons with unknown residence. Tabell 33. Døde etter kjønn og alder Deaths by sex and age 1967 1968 Menn Males Kvinner Females Menn Males Kvinner Females Alder' Her- Her Her- Her- Hele Byy" reds- Hele Byy- reds- Hele Byy- reds- Hele B y- reds- Age' landet komm. komm. landet komm. komm. landet komm. komm. landet komm. komm. The Urban Rural The Urban Rural The Urban Rural The Urban Rural whole muni- muni- whole muni- muni- whole muni- muni- whole muni- municountry cip. cip country cip. cip country cip. cip country cip. cip 0år year 563 233 330 422 151 271 520 229 291 403 152 251 1 » » 50 16 34 36 10 26 36 16 20 35 10 25 2 » years 31 11 20 14 5 9 36 13 23 29 9 20 3 » » 33 13 20 26 10 16 35 11 24 25 9 16 4 » » 23 13 10 13 4 9 24 11 13 12 2 10 0- 4 » » 700 286 414 511 180 331 651 280 371 504 182 322 5- 9 » » 81 25 56 36 7 29 102 29 73 37 14 23 10-•14 » » 75 24 51 38 15 23 60 20 40 25 9 16 15-19 » » 143 42 101 57 24 33 156 57 99 51 18 33 20-24 » » 162 66 96 41 13 28 176 72 104 58 30 28 25-29 » » 113 46 67 43 20 23 118 47 71 43 19 24 30-34 » » 134 48 86 57 24 33 142 60 82 51 19 32 35-39 » » 196 78 118 107 49 58 196 75 121 89 37 52 40-44 » » 357 163 194 167 74 93 358 159 199 185 87 98 45-49 » » 607 273 334 277 114 163 603 265 338 306 146 160 50-54 » » 855 375 480 460 231 229 870 420 450 436 230 206 55-59 » » 1 266 611 655 672 318 354 1 300 648 652 685 333 352 60-64 » » 1 777 892 885 1 018 516 502 1 891 937 954 1 026 515 511 65-69 » » 2 538 1 223 1 315 1 606 799 807 2 496 1 233 1 263 1 662 849 813 70-74 » » 2 845 1 325 1 520 2 282 1 097 1 185 3 078 1 471 1 607 2 416 1 178 1 238 75-79 » » 2 869 1 238 1 631 2 840 1 332 1 508 2 984 1 305 1 679 2 992 1 393 1 599 80-84 » » 2 500 947 1 553 2 844 1 283 1 561 2 641 1 037 1 604 3 160 1 474 1 686 85-89 » » 1 602 583 1 019 2 144 953 1 191 1 668 632 1 036 2 172 999 1 173 90 år og over years and over 910 277 633 1 286 530 756 888 299 589 1 392 570 822 Alle aldersgr. All ages .... 19 730 8 522 11 208 16 486 7 579 8 907 20 378 9 046 11 332 17 290 8 102 9 188 K i 1 cl e : NOS Folkemengdens bevegelse. Source: NOS Vital Statistics and Migration Statistics. Note: i Alder = fylte år. Note: 1 Age = complete years.
- Page 1 and 2:
NORGES OFFISIELLE STATISTIKK XII 26
- Page 3 and 4: Forord Statistisk årbok inneholder
- Page 5 and 6: *5 Innhold Contents Side Page Tabel
- Page 7 and 8: *7 Tabell Side 48. Døde etter alde
- Page 9 and 10: *9 Tabell Side 118. Skogeiendommer
- Page 11 and 12: *11 Tabell Side Table Page IX. Inne
- Page 13 and 14: '13 Tabell Side 259. Kommuneskattel
- Page 15 and 16: *15 Tabell Side 332. Månedsfortjen
- Page 17 and 18: *17 Tabell Side 398. Svenneprøver
- Page 19 and 20: *19 Side Administrative delinger 2
- Page 21 and 22: *21 Side Forgiftninger 35, 36 For,
- Page 23 and 24: *23 Side Laste- og lossearbeidere,
- Page 25 and 26: *25 Side Skiftevesen 293, 294 Skifo
- Page 27 and 28: "27 Alphabetical index) Page Accide
- Page 29 and 30: * 29 Page Gross fixed capital forma
- Page 31: *31 Page Teachers 295, 296, 298 tra
- Page 34 and 35: 2 Tabell 2. Administrative inndelin
- Page 36 and 37: 4 Tabell 3 (forts.). Meteorologiske
- Page 38 and 39: Fylke County 6 Tabell 6. Flateinnho
- Page 40 and 41: 8 Tabell 8 (forts.). Hjemmehørende
- Page 42 and 43: 10 Alder Age Tabell 9. Hjemmehøren
- Page 44 and 45: Hele landet The whole country 1930
- Page 46 and 47: 14 Tabell 16. Private husholdninger
- Page 48 and 49: 16 Tabell 18. Folkemengdens bevegel
- Page 50 and 51: År' Year lS Tabell 20. Inngåtte e
- Page 52 and 53: 20 Tabell 26. Fodte Births At' Year
- Page 56 and 57: 24 r yuae vouncy Tabell 34. Dødeli
- Page 58 and 59: 25 Tabell 37. Dødelighetstabeller.
- Page 60 and 61: 28 Tabell 40. Flyttinger til og fra
- Page 62 and 63: 30 Tabell 44. Belegg og endringer i
- Page 64 and 65: 32 Tabell 48. Døde etter alder og
- Page 66 and 67: 34 Tabell 49. Dodelighet av ondarte
- Page 68 and 69: 36 Tabell 53. Dødsfall ved yrkesul
- Page 70 and 71: 38 Tabell 56. Vernepliktige etter s
- Page 72 and 73: 1964 40 Tabell 59. Sysselsatte løn
- Page 74 and 75: 42 Tabell 60. Sysselsatte lønnstak
- Page 76 and 77: 44 Tabell 63. Utlendinger i arbeid
- Page 78 and 79: 46 Tabell 66. Faktisk arbeidstid pr
- Page 80 and 81: 48 Tabell 71. Landsorganisasjonen i
- Page 82 and 83: 50 Tabell 72 (forts.). Arbeidstaker
- Page 84 and 85: 52 Tabell 74. Nasjonalprodukt etter
- Page 86 and 87: 54 Tabell 77. Faktorinntekt etter n
- Page 88 and 89: 56 Tabell 81. Private inntekter og
- Page 90 and 91: 58 Tabell 84 (forts.). Utenriksregn
- Page 92 and 93: 60 Tabell 86. Landarealet. Kms Land
- Page 94 and 95: 62 Tabell 92. Brukene etter jordbru
- Page 96 and 97: 64 År Year Tabell 97. Forbruk av k
- Page 98 and 99: 66 Tabell 101. Avling. Kg pr. dekar
- Page 100 and 101: 68 Tabell 105. Jordbrukets totalre;
- Page 102 and 103: 70 Tabell 107. Tinglyste hjemmelsov
- Page 104 and 105:
72 Tabell 111. Skogeiendommer etter
- Page 106 and 107:
74 Tabell 113. Skogeiendommers land
- Page 108 and 109:
76 Tabell 116. Foryngelsesareal, sk
- Page 110 and 111:
78 Tabell 119. Skogeiendommer eid a
- Page 112 and 113:
80 Tabell 123. Dagsverk i skogbruke
- Page 114 and 115:
82 Tabell 126. Skogtaksering. Kubik
- Page 116 and 117:
84 Tabell 128. Avvirket trevirke. m
- Page 118 and 119:
86 Tabell 132. Tommerfoting Timber
- Page 120 and 121:
88 Tabell 137. Fiskere og fiskefark
- Page 122 and 123:
90 Fiskeslag I Enhet unity 1887 198
- Page 124 and 125:
92 Tabell 142. Skreifisket og vårt
- Page 126 and 127:
94 Tabell 147. Fangstmengde av vikt
- Page 128 and 129:
96 Tabell 150. Selfangsten Sealing
- Page 130 and 131:
98 Tabell 154. Hvalfangsten 1 Whali
- Page 132 and 133:
100 Næringsgren Tabell 157. Bergve
- Page 134 and 135:
102 Tabell 158. Bergverksdrift og i
- Page 136 and 137:
104 Tabell 160 (forts.). Bergverksd
- Page 138 and 139:
106 Tabell 160 (forts.). Bergverksd
- Page 140 and 141:
108 Tabell 161. Meieridrift Dairyin
- Page 142 and 143:
110 Tabell 163. Indekser over produ
- Page 144 and 145:
112 Tabell 166. Bergverksdrift og i
- Page 146 and 147:
114 Tabell 170. Elektriske anlegg o
- Page 148 and 149:
116 Tabell 173. Maskininstallasjon
- Page 150 and 151:
118 Tabell 177. Byggevirksomhet Bui
- Page 152 and 153:
120 Tabell 180 (forts.). Inforeel a
- Page 154 and 155:
122 Tabell 180 (forts.). IØørsel
- Page 156 and 157:
124 Tabell 180 (forts.). Innførsel
- Page 158 and 159:
126 Tabell 181. Utførsel av viktig
- Page 160 and 161:
128 Tabell 181 (forts.). Utførsel
- Page 162 and 163:
130 Tabell 181 (forts.). Utførsel
- Page 164 and 165:
132 Tabell 182 (forts.). Indekser f
- Page 166 and 167:
134 Tabell 183 (forts.). Innførsel
- Page 168 and 169:
136 Tabell 183 (forts.). Innførsel
- Page 170 and 171:
138 Tabell 185. Innførsels- og utf
- Page 172 and 173:
140 Tabell 185 (forts.). Innførsel
- Page 174 and 175:
142 Tabe11186. Innfersels- og utfor
- Page 176 and 177:
144 Tabell 186 (forts.). Innførsel
- Page 178 and 179:
146 Tabell 186 (forts.). IØorsels-
- Page 180 and 181:
148 Tabell 187. Varehandel. hovedta
- Page 182 and 183:
150 Tabell 190. Forretningsmessig t
- Page 184 and 185:
152 Tabell 193. Forbrukssamvirket'
- Page 186 and 187:
154 Tabell 195. Lager av viktigere
- Page 188 and 189:
156 Ved utgangen av året At the en
- Page 190 and 191:
158 Tabell 203. Handelsfåten 1 ett
- Page 192 and 193:
160 Tabell 206. Opptjente bruttofra
- Page 194 and 195:
162 Tabell 211. Skipsfarten mellom
- Page 196 and 197:
164 Tabe11212 (forts.). Norske skip
- Page 198 and 199:
166 Tabell 212 (forts.). Norske ski
- Page 200 and 201:
168 Tabell 215. Statsbanene: anenet
- Page 202 and 203:
170 Tabell 220. Statsbanenes bildri
- Page 204 and 205:
172 Tabell 224. Motorkjøretøyer o
- Page 206 and 207:
174 Tabell 228. Nye førerkort og f
- Page 208 and 209:
176 Tabell 231. Veitratkkulykker fi
- Page 210 and 211:
178 Tabell 234. Veitrafikkulykker h
- Page 212 and 213:
180 Tabell 238. Land- og lufttransp
- Page 214 and 215:
182 Tabell 241. Ungdomsherberger, t
- Page 216 and 217:
Land Country 184 Tabell 246. Brevpo
- Page 218 and 219:
186 Tabell 250. Telefon-, telegram-
- Page 220 and 221:
188 Tabell 254. Norsk Rikskringkast
- Page 222 and 223:
190 Tabell 258. Den ordinære kommu
- Page 224 and 225:
192 Tabell 260. Personlige skattyte
- Page 226 and 227:
194 Tabell 261. Etterskottspliktige
- Page 228 and 229:
196 Tabell 264. Kommunenes utgifter
- Page 230 and 231:
108 Tabell 265. Kommunenes kontantb
- Page 232 and 233:
200 Tabell 267. Statskassens (bevil
- Page 234 and 235:
202 Aktiva Assets Tabell 268. State
- Page 236 and 237:
204 Tabell 269. Statsgjelden.' Mill
- Page 238 and 239:
206 Tabell 270. Statskassens (bevil
- Page 240 and 241:
208 Tabell 270 (forts.). Statskasse
- Page 242 and 243:
210 Tabell 270 (forts.). Statskasse
- Page 244 and 245:
212 Tabell 270 (forts.). Statskasse
- Page 246 and 247:
214 Tabell 270 (forts.). Statskasse
- Page 248 and 249:
216 Tabell 273. Norges Bank. Drifts
- Page 250 and 251:
218 Tabell 277. Statsbanker. Utlån
- Page 252 and 253:
220 Tabell 279. Forretningsbanker.
- Page 254 and 255:
222 Tabell 282. Sparebanker. Utest
- Page 256 and 257:
224 Tabell 285. Forretnings- og spa
- Page 258 and 259:
226 Tabell 287. Kredittforeninger o
- Page 260 and 261:
228 Tabell 289. Forsikringsselskape
- Page 262 and 263:
230 Tabell 293. Skadeforsikringssel
- Page 264 and 265:
232 Tabell 297. Norges Brannkasse.
- Page 266 and 267:
234 Tabell 30®. Ihendehaverobligas
- Page 268 and 269:
236 Tabell 303. Næringenes 1ån. 1
- Page 270 and 271:
238 Næring/Land Tabell 304. Fordri
- Page 272 and 273:
240 Tabell 305. Finansielle balanse
- Page 274 and 275:
242 Tabell 305 (forts.). Finansiell
- Page 276 and 277:
244 Tabell 306. Valutakurser' Forei
- Page 278 and 279:
246 Tabell 311. Produsentpriser på
- Page 280 and 281:
248 Tabell 317. Gjennomsnittspriser
- Page 282 and 283:
250 Ar Year Tabell 321. Konsumprisi
- Page 284 and 285:
252 Tabell 324. Husholdningenes gje
- Page 286 and 287:
254 Tabell 326. Timefortjeneste i b
- Page 288 and 289:
256 Tabell 326 (forts.). Timefortje
- Page 290 and 291:
258 Tabell 329. Timefortjeneste for
- Page 292 and 293:
260 Tabell 332. Månedsfortjeneste'
- Page 294 and 295:
262 Tabell 334. Månedsfortjeneste)
- Page 296 and 297:
264 Tabell 337. Månedsfortjeneste)
- Page 298 and 299:
266 Tabell 338. Månedsfortjeneste)
- Page 300 and 301:
268 Tabell 338 (forts.). Månedsfor
- Page 302 and 303:
270 Tabell 339. Månedsfortjeneste'
- Page 304 and 305:
272 Tabell 341. Syketrygden. Gjenno
- Page 306 and 307:
274 Trygdeart Type of benefit Tabel
- Page 308 and 309:
276 Fylke County Tabell 347. Folket
- Page 310 and 311:
278 Tabell 351. Folketrygden. Barne
- Page 312 and 313:
280 Tabell 354. Kommunalel trygder
- Page 314 and 315:
282 Tabell 356. Barnevern. Barn sat
- Page 316 and 317:
284 År Year Tabell 361. Edruskapsn
- Page 318 and 319:
286 Tabell 367. Forbrukt av brennev
- Page 320 and 321:
289 Tabell 374. Alkohollovforseelse
- Page 322 and 323:
291 Tabell 380. Belegget 1 i fengse
- Page 324 and 325:
293 Tabell 383. Åpnede konkurser o
- Page 326 and 327:
294 Tabell 386. Overformynderier Pu
- Page 328 and 329:
296 Tabell 389. Elever i barneskole
- Page 330 and 331:
298 Tabell 395. Fag- og yrkesskoler
- Page 332 and 333:
300 Tabell 398. Svenneprover og uts
- Page 334 and 335:
302 Tabell 400. Universiteter og h
- Page 336 and 337:
304 Tabell 402. Utgifter til norsk
- Page 338 and 339:
306 Tabell 406. Utgifter til forskn
- Page 340 and 341:
308 Tabell 409. Spesialbibliotek 19
- Page 342 and 343:
310 Tabell 409 (forts.). Spesialbib
- Page 344 and 345:
312 Tabell 413. Utgitte skjønnlitt
- Page 346 and 347:
314 Fylke County Tabell 418. Bokmå
- Page 348 and 349:
316 Tabell 421. Stortingsvalg. Pers
- Page 350 and 351:
318 Tabell 423. Kommunevalg. Person
- Page 352 and 353:
320 Tabell 424. Kommunevalg. Stemme
- Page 354 and 355:
322 Tabell 425. Personer som ikke s
- Page 356 and 357:
324 1 cm = 0,3937 inch f3,2808 feet
- Page 358 and 359:
326 Tabell 429 (forts.). Areal, fol
- Page 360 and 361:
328 Tabell 429 (forts.). Areal, fol
- Page 362 and 363:
330 Tabell 429 (forts.). Areal, fol
- Page 364 and 365:
332 Land og byer Tabell 430 (forts.
- Page 366 and 367:
334 Tabell 431. Folkemengden etter
- Page 368 and 369:
336 Tabell 431 (forts.). Folkemengd
- Page 370 and 371:
338 Tabell 433. Giftermål, fødsle
- Page 372 and 373:
340 Tabell 434. Fruktbarheten etter
- Page 374 and 375:
342 Tabell 436. Døde vr. 1000 innb
- Page 376 and 377:
344 Tabell 436 (forts.). Døde pr.
- Page 378 and 379:
346 Tabell 437. Dade pr. 100 000 li
- Page 380 and 381:
348 Tabell 438. Arbeidsløse.' 1000
- Page 382 and 383:
350 Tabell 440. Utenriksregnskap. 1
- Page 384 and 385:
S 5 2 Tabell 442. Landareal, jord-
- Page 386 and 387:
354 Land År Ialt Tabell 443. Fiske
- Page 388 and 389:
356 Tabell 445. Produksjonsindeks f
- Page 390 and 391:
358 Tabell 446 (forts.). Produksjon
- Page 392 and 393:
360 Tabell 446 (forts.). Produksjon
- Page 394 and 395:
362 Talvell 446 (forts.). Produksjo
- Page 396 and 397:
I Varesort og land 1965 Indial , 2
- Page 398 and 399:
366 Tabell 447. Produksjon av elekt
- Page 400 and 401:
368 Tabell 450. Verdien av forskjel
- Page 402 and 403:
370 Tabell 451. Frihandelsforbundet
- Page 404 and 405:
372 Tabell 454 (forts.). Innførsel
- Page 406 and 407:
374 Tabell 454 (forts.). Innførsel
- Page 408 and 409:
376 Tabell 454 (forts.). Innførsel
- Page 410 and 411:
Land 378 Tabell 455. Registrerte sk
- Page 412 and 413:
380 Tabell 458. De nordiske lands h
- Page 414 and 415:
382 Tabell 460. Jernbanenel Land Tr
- Page 416 and 417:
384 Tabell 462. Veitrafikkulykker i
- Page 418 and 419:
386 Land' Tabell 465. Flyselskapene
- Page 420 and 421:
388 Tabell 467. Telegraf og telefon
- Page 422 and 423:
390 Tabell 469. Internasjonal likvi
- Page 424 and 425:
392 Tabell 473. Engrospris indekse.
- Page 426 and 427:
394 Land Ar' Tabell 475. Forbruket
- Page 428 and 429:
396 Land Tabell 477. Forbruket av n
- Page 430 and 431:
398 Tabell 479. Universiteter og h
- Page 433 and 434:
401 Vedlegg 1 Appendix 1 Publikasjo
- Page 435:
403 I serien Artikler fra Statistis