1964 40 Tabell 59. Sysselsatte lønnstakere etter næring. 1000 Nr.' Næring 1961 11962 1963 I Gjennomsnitt Average 1965 1966 1967 01 Jordbruk 19,8 17,9 16,2 15,0 13,8 12,8 11,9 02 Skogbruk m. v 20,1 18,8 16,9 16,0 14,6 12,8 12,0 04-06 Fiske og fangst 10,2 8,2 6,2 6,0 5,6 5,5 6,2 11-19 Bergverksdrift m. v 2 8,1 7,8 7,4 7,3 7,3 7,3 7,4 20 Næringsmiddelindustri 42,2 42,6 42,4 42,2 42,8 44,1 43,7 Av dette: 204 Fiske- og kjøtthermetikkfabrikker 6,4 6,5 5,8 5,8 5,6 5,6 5,6 205 Fisketilvirking 7,8 7,5 7,6 7,6 8,1 8,9 8,5 21-22 Drikkevare- og tobakksindustri 5,8 5,6 5,7 5,6 5,6 5,6 5,6 23 Tekstilindustri 17,9 17,7 18,1 18,2 17,7 17,4 17,0 24 Bekledningsindustri m. v 26,6 26,2 26,3 25,6 24,1 23,4 23,0 Av dette: 241-242 Skofabr. og skorep.verkst. 5,3 5,2 5,1 5,1 4,6 4,4 4,1 25 Treindustri 13,5 13,3 12,8 13,1 13,5 13,6 14,1 Av dette: 251 Sagbruk og høvlerier 9,2 9,1 8,8 9,1 9,1 8,7 8,8 26 Møbel- og innredningsindustri 13,8 13,6 13,5 13,6 13,8 13,8 14,0 27 Treforedlingsindustri 28,3 27,8 27,4 27,4 27,1 26,6 25,9 28 Grafisk industri, forlag m. v 21,4 22,1 22,3 22,4 22,7 22,9 22,3 29 Lærindustri 2,1 1,8 1,8 1,8 1,6 1,6 1,5 30 Gummivareindustri 3,9 4,1 4,1 3,9 4,1 4,4 4,6 31-32 Kjem. had., kull- og min.oljeforedling 21,5 21,7 21,8 22,3 23,4 24,4 24,6 Av dette: 311 Kjemisk grunnindustri 11,2 11,8 11,8 11,7 12,2 12,2 11,9 312 Olje- og fettindustri 3,5 3,1 3,1 3,5 3,8 4,6 4,9 33 Jord- og steinvareindustri 12,4 12,5 12,3 12,6 12,9 12,9 13,2 34 Primær jern- og metallindustri 22,9 23,2 22,6 23,5 24,3 24,9 25,5 35 Jern- og metallvareindustri3 24,3 24,8 24,9 25,5 26,0 26,2 27,2 36 Maskinindustri 13,7 14,4 14,7 15,1 15,7 16,2 16,7 37 Elektroteknisk industri 15,0 15,5 16,4 16,4 16,8 17,7 18,7 38 Transportmiddelindustri 47,9 49,8 49,5 51,3 54,0 56,7 58,0 Av dette : 381 Skipsindustri 28,7 29,9 28,9 30,1 32,1 34,4 35,0 39 Diverse industri 6,0 6,4 6,6 6,9 7,3 7,4 7,8 20-39 Industri i alt3 339,2 343,1 343,2 347,4 353,4 359,8 363,4 41 Byggevirksomhet 62,7 63,6 63,1 63,8 63,8 64,4 68,8 42 Anleggsvirksomhet 37,0 37,5 38,3 37,9 37,7 38,0 38,5 51-52 Kraft- og vannforsyning m. v. 12,6 12,7 13,5 13,8 13,9 14,1 14,3 61-66 Varehandel 139,7 144,0 146,9 150,1 153,4 156,6 160,7 64-65 Av dette: Detaljhandel 87,3 89,1 90,7 92,4 93,7 94,8 96,7 67-69 Finansinstitusjoner og eiendomsdrift 24,8 26,1 27,2 27,9 29,0 29,9 31,1 71-73 Sjøtransport 66,9 66,3 66,8 66,3 64,9 63,7 62,5 74-78 Annen samferdsel4 70,3 71,1 71,6 71,9 72,1 72,4 73,1 81 Offentlig administrasjon og forsvar 62,1 63,8 66,2 67,5 68,4 68.9 70.2 814 Av dette: Forsvar 23,5 24,7 26,3 26,9 26,7 26,4 26,4 82 Undervisning 45,2 48,0 50,8 54,0 57,0 59,7 62,9 83 Helse- og veterinærvesen 40,3 42,2 44,0 45,3 46,6 48,1 50,0 84-87 Annet under off. og privat tjenesteyting 42,5 44,0 45,1 47,5 49,9 52,0 55,1 91 Lønt husarbeid 20,3 18,9 17,8 16,6 15,5 14,3 12,6 92 Hotell- og restaurantdrift 25,4 25,9 25,8 26,2 26,6 26,7 27,1 93 Vask, rens. og andre pers. tjenester 10,7 11,0 11,2 10,8 11,0 11,0 11,0 61-93 I alt4 548,2 561,3 573,4 584,1 594,4 603,3 616,3 01-93 I alt 2, 3,4 1 057,9 1 070,9 1078,2 1 091,3 1104,5 1118,0 1 138,8 Kilde : NOS Arbeidsmarkedstatistikk. Noter: ' I samsvar med Standard for næringsgruppering i offentlig norsk stat'stikk. 2 Fra og med 1968 er medregnet sysselsatte på Svalbard, ikke registrert tidligere (i alt 659 personer i 1968). 2 Fra og med 1968 er medregnet sysselsatte i en offentlig bedrift, ikke registrert tidligere (i alt 579 personer i 1968). ' Fra og med 1968 er medregnet sysselsatte i sivil luftfart, ikke registrert tidligere (i alt 643 personer i 1968).
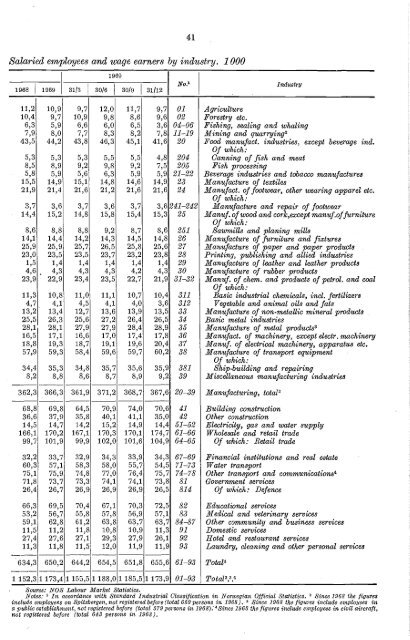
41 Salaried employees and wage earners by industry. 1000 1969 1968 1969 3113 30/6 I 30/9 31/12 No . 1 Industry 11,2 10,9 9,7 12,0 11,7 9,7 01 Agriculture 10,4 9,7 10,9 9,8 8,6 9,6 02 Forestry etc. 6,3 5,9 6,6 6,0 6,5 3,6 04-06 Fishing, sealing and whaling 7,9 8,0 7,7 8,3 8,2 7,8 11-19 Mining and quarrying° 43,5 44,2 43,8 46,3 45,1 41,6 20 Food manufact. industries, except beverage bid. Of which: 5,3 5,3 5,3 5,5 5,5 4,8 204 Canning of fish and meat 8,5 8,9 9,2 9,8 9,2 7,5 205 Fish processing 5,8 5,9 5,6 6,3 5,9 5,9 21-22 Beverage industries and tobacco manufactures 15,5 14,9 15,1 14,8 14,6 14,9 23 Manufacture of textiles 21,9 21,4 21,6 21,2 21,6 21,6 24 Manufact. of footwear, other wearing apparel etc. Of which: 3,7 3,6 3,7 3,6 3,7 3,6 241-242 Manufacture and repair of footwear 14,4 15,2 14,8 15,8 15,4 15,3 25 Manuf. of wood and cork,except manuf.of furniture Of which: 8,6 8,8 8,8 9,2 8,7 8,6 251 Sawmills and planing mills 14,1 14,4 14,2 14,3 14,5 14,8 26 Manufacture of furniture and fixtures 25,9 25,9 25,7 26,5 25,8 25,6 27 Manufacture of paper and paper products 23,0 23,5 23,5 23,7 23,2 23,8 28 Printing, publishing and allied industries 1,5 1,4 1,4 1,4 1,4 1,4 29 Manufacture of leather and leather products 4,6 , 4,3 4,3 4,3 4,2 4,3 30 Manufacture of rubber products 23,9 22,9 23,4 23,5 22,7 21,9 31-32 Manuf. of chem. and products of petrol. and coal Of which: 11,3 10,8 11,0 11,1 10,7 10,4 311 Basic industrial chemicals, incl. fertilizers 4,7 4,1 4,5 4,1 4,0 3,6 312 Vegetable and animal oils and fats 13,2 13,4 12,7 13,6 13,9 13,5 33 Manufacture of non-metallic mineral products 25,5 26,3 25,6 27,2 26,4 26,5 34 Basic metal industries 28,1 28,1 27,9 27,9 28,4 28,9 35 Manufacture of metal products° 16,5 17,1 16,6 17,0 17,4 17,8 36 Manufact. of machinery, except electr. machinery 18,8 19,3 18,7 19,1 19,6 20,4 37 Manuf. of electrical machinery, apparatus etc. 57,9 59,3 58,4 59,6 59,7 60,2 38 Manufacture of transport equipment Of which: 34,4 35,3 34,8 35,7 35,6 35,9 381 Ship-building and repairing 8,2 8,8 8,6 8,7 8,9 9,2 39 Miscellaneous manufacturing industries 362,3 366,3 361,9 371,2 368,7 367,6 20-39 Manufacturing, total° 68,8 69,8 64,5 70,9 74,0 70,6 41 Building construction 36,6 37,9 35,8 40,1 41,1 35,0 42 Other construction 14,5 14,7 14,2 15,2 14,9 14,4 51-52 Electricity, gas and water supply 166,1 170,2 167,1 170,3 170,1 174,7 61-66 Wholesale and retail trade 99,7 101,9 99,9 102,0 101,6 104,9 64-65 Of which: Retail trade 32,2 33,7 32,9 34,3 33,9 34,3 67-69 Financial institutions and real estate 60,3 57,1 58,3 58,0 55,7 54,5 71-73 Water transport 75,1 75,9 74,8 77,0 76,4 75,7 74-78 Other transport and communications" 71,8 73,7 73,3 74,1 74,1 73,8 81 Government services 26,4 26,7 26,9 26,9 26,9 26,5 814 Of which: Defence 66,3 69,5 70,4 67,1 70,3 72,5 82 Educational services 53,2 56,7 55,8 57,8 56,9 57,1 83 Medical and veterinary services 59,1 62,8 61,2 63,8 63,7 63,7 84-87 Other community and business services 11,5 11,2 11,8 10,8 10,9 11,3 91 Domestic services 27,4 27,6 27,1 29,3 27,9 26,1 92 Hotel and restaurant services 11,3 11,8 11,5 12,0 11,9 11,9 93 Laundry, cleaning and other personal services 634,3 650,2 644,2 654,5 651,8 655,6 61-93 Total" 1 152,3 1 173,4 1 155,5 1 188,0 1 185,5 1 173,9 01-93 Tota12,°," Source: NOS Labour Market S atistics. Notes: ' In accordance with Standard Industrial Classification in Norwegian Official Statistics. Since 1968 the figures include employees on Spitzbergen, not registered before (total 659 persons in 1968). J Since 1968 the figures include employees in a public establishment, not registered before (total 579 persons in 1968): 1 Since 1968 the figures include employees in civil aircraft, not registered before (total 643 persons in 1968).
- Page 1 and 2:
NORGES OFFISIELLE STATISTIKK XII 26
- Page 3 and 4:
Forord Statistisk årbok inneholder
- Page 5 and 6:
*5 Innhold Contents Side Page Tabel
- Page 7 and 8:
*7 Tabell Side 48. Døde etter alde
- Page 9 and 10:
*9 Tabell Side 118. Skogeiendommer
- Page 11 and 12:
*11 Tabell Side Table Page IX. Inne
- Page 13 and 14:
'13 Tabell Side 259. Kommuneskattel
- Page 15 and 16:
*15 Tabell Side 332. Månedsfortjen
- Page 17 and 18:
*17 Tabell Side 398. Svenneprøver
- Page 19 and 20:
*19 Side Administrative delinger 2
- Page 21 and 22: *21 Side Forgiftninger 35, 36 For,
- Page 23 and 24: *23 Side Laste- og lossearbeidere,
- Page 25 and 26: *25 Side Skiftevesen 293, 294 Skifo
- Page 27 and 28: "27 Alphabetical index) Page Accide
- Page 29 and 30: * 29 Page Gross fixed capital forma
- Page 31: *31 Page Teachers 295, 296, 298 tra
- Page 34 and 35: 2 Tabell 2. Administrative inndelin
- Page 36 and 37: 4 Tabell 3 (forts.). Meteorologiske
- Page 38 and 39: Fylke County 6 Tabell 6. Flateinnho
- Page 40 and 41: 8 Tabell 8 (forts.). Hjemmehørende
- Page 42 and 43: 10 Alder Age Tabell 9. Hjemmehøren
- Page 44 and 45: Hele landet The whole country 1930
- Page 46 and 47: 14 Tabell 16. Private husholdninger
- Page 48 and 49: 16 Tabell 18. Folkemengdens bevegel
- Page 50 and 51: År' Year lS Tabell 20. Inngåtte e
- Page 52 and 53: 20 Tabell 26. Fodte Births At' Year
- Page 54 and 55: 22 Tabell 30. Dødelighet i 1. leve
- Page 56 and 57: 24 r yuae vouncy Tabell 34. Dødeli
- Page 58 and 59: 25 Tabell 37. Dødelighetstabeller.
- Page 60 and 61: 28 Tabell 40. Flyttinger til og fra
- Page 62 and 63: 30 Tabell 44. Belegg og endringer i
- Page 64 and 65: 32 Tabell 48. Døde etter alder og
- Page 66 and 67: 34 Tabell 49. Dodelighet av ondarte
- Page 68 and 69: 36 Tabell 53. Dødsfall ved yrkesul
- Page 70 and 71: 38 Tabell 56. Vernepliktige etter s
- Page 74 and 75: 42 Tabell 60. Sysselsatte lønnstak
- Page 76 and 77: 44 Tabell 63. Utlendinger i arbeid
- Page 78 and 79: 46 Tabell 66. Faktisk arbeidstid pr
- Page 80 and 81: 48 Tabell 71. Landsorganisasjonen i
- Page 82 and 83: 50 Tabell 72 (forts.). Arbeidstaker
- Page 84 and 85: 52 Tabell 74. Nasjonalprodukt etter
- Page 86 and 87: 54 Tabell 77. Faktorinntekt etter n
- Page 88 and 89: 56 Tabell 81. Private inntekter og
- Page 90 and 91: 58 Tabell 84 (forts.). Utenriksregn
- Page 92 and 93: 60 Tabell 86. Landarealet. Kms Land
- Page 94 and 95: 62 Tabell 92. Brukene etter jordbru
- Page 96 and 97: 64 År Year Tabell 97. Forbruk av k
- Page 98 and 99: 66 Tabell 101. Avling. Kg pr. dekar
- Page 100 and 101: 68 Tabell 105. Jordbrukets totalre;
- Page 102 and 103: 70 Tabell 107. Tinglyste hjemmelsov
- Page 104 and 105: 72 Tabell 111. Skogeiendommer etter
- Page 106 and 107: 74 Tabell 113. Skogeiendommers land
- Page 108 and 109: 76 Tabell 116. Foryngelsesareal, sk
- Page 110 and 111: 78 Tabell 119. Skogeiendommer eid a
- Page 112 and 113: 80 Tabell 123. Dagsverk i skogbruke
- Page 114 and 115: 82 Tabell 126. Skogtaksering. Kubik
- Page 116 and 117: 84 Tabell 128. Avvirket trevirke. m
- Page 118 and 119: 86 Tabell 132. Tommerfoting Timber
- Page 120 and 121: 88 Tabell 137. Fiskere og fiskefark
- Page 122 and 123:
90 Fiskeslag I Enhet unity 1887 198
- Page 124 and 125:
92 Tabell 142. Skreifisket og vårt
- Page 126 and 127:
94 Tabell 147. Fangstmengde av vikt
- Page 128 and 129:
96 Tabell 150. Selfangsten Sealing
- Page 130 and 131:
98 Tabell 154. Hvalfangsten 1 Whali
- Page 132 and 133:
100 Næringsgren Tabell 157. Bergve
- Page 134 and 135:
102 Tabell 158. Bergverksdrift og i
- Page 136 and 137:
104 Tabell 160 (forts.). Bergverksd
- Page 138 and 139:
106 Tabell 160 (forts.). Bergverksd
- Page 140 and 141:
108 Tabell 161. Meieridrift Dairyin
- Page 142 and 143:
110 Tabell 163. Indekser over produ
- Page 144 and 145:
112 Tabell 166. Bergverksdrift og i
- Page 146 and 147:
114 Tabell 170. Elektriske anlegg o
- Page 148 and 149:
116 Tabell 173. Maskininstallasjon
- Page 150 and 151:
118 Tabell 177. Byggevirksomhet Bui
- Page 152 and 153:
120 Tabell 180 (forts.). Inforeel a
- Page 154 and 155:
122 Tabell 180 (forts.). IØørsel
- Page 156 and 157:
124 Tabell 180 (forts.). Innførsel
- Page 158 and 159:
126 Tabell 181. Utførsel av viktig
- Page 160 and 161:
128 Tabell 181 (forts.). Utførsel
- Page 162 and 163:
130 Tabell 181 (forts.). Utførsel
- Page 164 and 165:
132 Tabell 182 (forts.). Indekser f
- Page 166 and 167:
134 Tabell 183 (forts.). Innførsel
- Page 168 and 169:
136 Tabell 183 (forts.). Innførsel
- Page 170 and 171:
138 Tabell 185. Innførsels- og utf
- Page 172 and 173:
140 Tabell 185 (forts.). Innførsel
- Page 174 and 175:
142 Tabe11186. Innfersels- og utfor
- Page 176 and 177:
144 Tabell 186 (forts.). Innførsel
- Page 178 and 179:
146 Tabell 186 (forts.). IØorsels-
- Page 180 and 181:
148 Tabell 187. Varehandel. hovedta
- Page 182 and 183:
150 Tabell 190. Forretningsmessig t
- Page 184 and 185:
152 Tabell 193. Forbrukssamvirket'
- Page 186 and 187:
154 Tabell 195. Lager av viktigere
- Page 188 and 189:
156 Ved utgangen av året At the en
- Page 190 and 191:
158 Tabell 203. Handelsfåten 1 ett
- Page 192 and 193:
160 Tabell 206. Opptjente bruttofra
- Page 194 and 195:
162 Tabell 211. Skipsfarten mellom
- Page 196 and 197:
164 Tabe11212 (forts.). Norske skip
- Page 198 and 199:
166 Tabell 212 (forts.). Norske ski
- Page 200 and 201:
168 Tabell 215. Statsbanene: anenet
- Page 202 and 203:
170 Tabell 220. Statsbanenes bildri
- Page 204 and 205:
172 Tabell 224. Motorkjøretøyer o
- Page 206 and 207:
174 Tabell 228. Nye førerkort og f
- Page 208 and 209:
176 Tabell 231. Veitratkkulykker fi
- Page 210 and 211:
178 Tabell 234. Veitrafikkulykker h
- Page 212 and 213:
180 Tabell 238. Land- og lufttransp
- Page 214 and 215:
182 Tabell 241. Ungdomsherberger, t
- Page 216 and 217:
Land Country 184 Tabell 246. Brevpo
- Page 218 and 219:
186 Tabell 250. Telefon-, telegram-
- Page 220 and 221:
188 Tabell 254. Norsk Rikskringkast
- Page 222 and 223:
190 Tabell 258. Den ordinære kommu
- Page 224 and 225:
192 Tabell 260. Personlige skattyte
- Page 226 and 227:
194 Tabell 261. Etterskottspliktige
- Page 228 and 229:
196 Tabell 264. Kommunenes utgifter
- Page 230 and 231:
108 Tabell 265. Kommunenes kontantb
- Page 232 and 233:
200 Tabell 267. Statskassens (bevil
- Page 234 and 235:
202 Aktiva Assets Tabell 268. State
- Page 236 and 237:
204 Tabell 269. Statsgjelden.' Mill
- Page 238 and 239:
206 Tabell 270. Statskassens (bevil
- Page 240 and 241:
208 Tabell 270 (forts.). Statskasse
- Page 242 and 243:
210 Tabell 270 (forts.). Statskasse
- Page 244 and 245:
212 Tabell 270 (forts.). Statskasse
- Page 246 and 247:
214 Tabell 270 (forts.). Statskasse
- Page 248 and 249:
216 Tabell 273. Norges Bank. Drifts
- Page 250 and 251:
218 Tabell 277. Statsbanker. Utlån
- Page 252 and 253:
220 Tabell 279. Forretningsbanker.
- Page 254 and 255:
222 Tabell 282. Sparebanker. Utest
- Page 256 and 257:
224 Tabell 285. Forretnings- og spa
- Page 258 and 259:
226 Tabell 287. Kredittforeninger o
- Page 260 and 261:
228 Tabell 289. Forsikringsselskape
- Page 262 and 263:
230 Tabell 293. Skadeforsikringssel
- Page 264 and 265:
232 Tabell 297. Norges Brannkasse.
- Page 266 and 267:
234 Tabell 30®. Ihendehaverobligas
- Page 268 and 269:
236 Tabell 303. Næringenes 1ån. 1
- Page 270 and 271:
238 Næring/Land Tabell 304. Fordri
- Page 272 and 273:
240 Tabell 305. Finansielle balanse
- Page 274 and 275:
242 Tabell 305 (forts.). Finansiell
- Page 276 and 277:
244 Tabell 306. Valutakurser' Forei
- Page 278 and 279:
246 Tabell 311. Produsentpriser på
- Page 280 and 281:
248 Tabell 317. Gjennomsnittspriser
- Page 282 and 283:
250 Ar Year Tabell 321. Konsumprisi
- Page 284 and 285:
252 Tabell 324. Husholdningenes gje
- Page 286 and 287:
254 Tabell 326. Timefortjeneste i b
- Page 288 and 289:
256 Tabell 326 (forts.). Timefortje
- Page 290 and 291:
258 Tabell 329. Timefortjeneste for
- Page 292 and 293:
260 Tabell 332. Månedsfortjeneste'
- Page 294 and 295:
262 Tabell 334. Månedsfortjeneste)
- Page 296 and 297:
264 Tabell 337. Månedsfortjeneste)
- Page 298 and 299:
266 Tabell 338. Månedsfortjeneste)
- Page 300 and 301:
268 Tabell 338 (forts.). Månedsfor
- Page 302 and 303:
270 Tabell 339. Månedsfortjeneste'
- Page 304 and 305:
272 Tabell 341. Syketrygden. Gjenno
- Page 306 and 307:
274 Trygdeart Type of benefit Tabel
- Page 308 and 309:
276 Fylke County Tabell 347. Folket
- Page 310 and 311:
278 Tabell 351. Folketrygden. Barne
- Page 312 and 313:
280 Tabell 354. Kommunalel trygder
- Page 314 and 315:
282 Tabell 356. Barnevern. Barn sat
- Page 316 and 317:
284 År Year Tabell 361. Edruskapsn
- Page 318 and 319:
286 Tabell 367. Forbrukt av brennev
- Page 320 and 321:
289 Tabell 374. Alkohollovforseelse
- Page 322 and 323:
291 Tabell 380. Belegget 1 i fengse
- Page 324 and 325:
293 Tabell 383. Åpnede konkurser o
- Page 326 and 327:
294 Tabell 386. Overformynderier Pu
- Page 328 and 329:
296 Tabell 389. Elever i barneskole
- Page 330 and 331:
298 Tabell 395. Fag- og yrkesskoler
- Page 332 and 333:
300 Tabell 398. Svenneprover og uts
- Page 334 and 335:
302 Tabell 400. Universiteter og h
- Page 336 and 337:
304 Tabell 402. Utgifter til norsk
- Page 338 and 339:
306 Tabell 406. Utgifter til forskn
- Page 340 and 341:
308 Tabell 409. Spesialbibliotek 19
- Page 342 and 343:
310 Tabell 409 (forts.). Spesialbib
- Page 344 and 345:
312 Tabell 413. Utgitte skjønnlitt
- Page 346 and 347:
314 Fylke County Tabell 418. Bokmå
- Page 348 and 349:
316 Tabell 421. Stortingsvalg. Pers
- Page 350 and 351:
318 Tabell 423. Kommunevalg. Person
- Page 352 and 353:
320 Tabell 424. Kommunevalg. Stemme
- Page 354 and 355:
322 Tabell 425. Personer som ikke s
- Page 356 and 357:
324 1 cm = 0,3937 inch f3,2808 feet
- Page 358 and 359:
326 Tabell 429 (forts.). Areal, fol
- Page 360 and 361:
328 Tabell 429 (forts.). Areal, fol
- Page 362 and 363:
330 Tabell 429 (forts.). Areal, fol
- Page 364 and 365:
332 Land og byer Tabell 430 (forts.
- Page 366 and 367:
334 Tabell 431. Folkemengden etter
- Page 368 and 369:
336 Tabell 431 (forts.). Folkemengd
- Page 370 and 371:
338 Tabell 433. Giftermål, fødsle
- Page 372 and 373:
340 Tabell 434. Fruktbarheten etter
- Page 374 and 375:
342 Tabell 436. Døde vr. 1000 innb
- Page 376 and 377:
344 Tabell 436 (forts.). Døde pr.
- Page 378 and 379:
346 Tabell 437. Dade pr. 100 000 li
- Page 380 and 381:
348 Tabell 438. Arbeidsløse.' 1000
- Page 382 and 383:
350 Tabell 440. Utenriksregnskap. 1
- Page 384 and 385:
S 5 2 Tabell 442. Landareal, jord-
- Page 386 and 387:
354 Land År Ialt Tabell 443. Fiske
- Page 388 and 389:
356 Tabell 445. Produksjonsindeks f
- Page 390 and 391:
358 Tabell 446 (forts.). Produksjon
- Page 392 and 393:
360 Tabell 446 (forts.). Produksjon
- Page 394 and 395:
362 Talvell 446 (forts.). Produksjo
- Page 396 and 397:
I Varesort og land 1965 Indial , 2
- Page 398 and 399:
366 Tabell 447. Produksjon av elekt
- Page 400 and 401:
368 Tabell 450. Verdien av forskjel
- Page 402 and 403:
370 Tabell 451. Frihandelsforbundet
- Page 404 and 405:
372 Tabell 454 (forts.). Innførsel
- Page 406 and 407:
374 Tabell 454 (forts.). Innførsel
- Page 408 and 409:
376 Tabell 454 (forts.). Innførsel
- Page 410 and 411:
Land 378 Tabell 455. Registrerte sk
- Page 412 and 413:
380 Tabell 458. De nordiske lands h
- Page 414 and 415:
382 Tabell 460. Jernbanenel Land Tr
- Page 416 and 417:
384 Tabell 462. Veitrafikkulykker i
- Page 418 and 419:
386 Land' Tabell 465. Flyselskapene
- Page 420 and 421:
388 Tabell 467. Telegraf og telefon
- Page 422 and 423:
390 Tabell 469. Internasjonal likvi
- Page 424 and 425:
392 Tabell 473. Engrospris indekse.
- Page 426 and 427:
394 Land Ar' Tabell 475. Forbruket
- Page 428 and 429:
396 Land Tabell 477. Forbruket av n
- Page 430 and 431:
398 Tabell 479. Universiteter og h
- Page 433 and 434:
401 Vedlegg 1 Appendix 1 Publikasjo
- Page 435:
403 I serien Artikler fra Statistis