2002 e suas Implicações para a Contribuição da
2002 e suas Implicações para a Contribuição da
2002 e suas Implicações para a Contribuição da

Create successful ePaper yourself
Turn your PDF publications into a flip-book with our unique Google optimized e-Paper software.
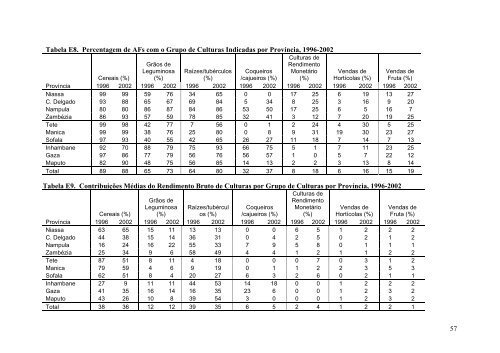
Tabela E8. Percentagem de AFs com o Grupo de Culturas Indica<strong>da</strong>s por Província, 1996-<strong>2002</strong><br />
Grãos de<br />
Leguminosa<br />
(%)<br />
Culturas de<br />
Rendimento<br />
Monetário<br />
(%)<br />
Raízes/tubérculos Coqueiros<br />
Ven<strong>da</strong>s de Ven<strong>da</strong>s de<br />
Cereais (%)<br />
(%) /cajueiros (%)<br />
Hortícolas (%) Fruta (%)<br />
Província 1996 <strong>2002</strong> 1996 <strong>2002</strong> 1996 <strong>2002</strong> 1996 <strong>2002</strong> 1996 <strong>2002</strong> 1996 <strong>2002</strong> 1996 <strong>2002</strong><br />
Niassa 99 99 59 76 34 65 0 0 17 25 6 19 13 27<br />
C. Delgado 93 88 65 67 69 84 5 34 8 25 3 16 9 20<br />
Nampula 80 80 86 87 84 86 53 50 17 25 6 5 16 7<br />
Zambézia 86 93 57 59 78 85 32 41 3 12 7 20 19 25<br />
Tete 99 98 42 77 7 56 0 1 2 24 4 30 5 25<br />
Manica 99 99 38 76 25 80 0 8 9 31 19 30 23 27<br />
Sofala 97 93 40 55 42 65 26 27 11 18 7 14 7 13<br />
Inhambane 92 70 88 79 75 93 66 75 5 1 7 11 23 25<br />
Gaza 97 86 77 79 56 76 56 57 1 0 5 7 22 12<br />
Maputo 82 90 48 75 56 85 14 13 2 2 3 13 8 14<br />
Total 89 88 65 73 64 80 32 37 8 18 6 16 15 19<br />
Tabela E9. Contribuições Médias do Rendimento Bruto de Culturas por Grupo de Culturas por Província, 1996-<strong>2002</strong><br />
Grãos de<br />
Leguminosa<br />
(%)<br />
Culturas de<br />
Rendimento<br />
Monetário<br />
(%)<br />
Raízes/tubércul Coqueiros<br />
Ven<strong>da</strong>s de Ven<strong>da</strong>s de<br />
Cereais (%)<br />
os (%) /cajueiros (%)<br />
Hortícolas (%) Fruta (%)<br />
Província 1996 <strong>2002</strong> 1996 <strong>2002</strong> 1996 <strong>2002</strong> 1996 <strong>2002</strong> 1996 <strong>2002</strong> 1996 <strong>2002</strong> 1996 <strong>2002</strong><br />
Niassa 63 65 15 11 13 13 0 0 6 5 1 2 2 2<br />
C. Delgado 44 38 15 14 36 31 0 4 2 5 0 2 1 2<br />
Nampula 16 24 16 22 55 33 7 9 5 8 0 1 1 1<br />
Zambézia 25 34 9 6 58 49 4 4 1 2 1 1 2 2<br />
Tete 87 51 8 11 4 18 0 0 0 7 0 3 1 2<br />
Manica 79 59 4 6 9 19 0 1 1 2 2 3 5 3<br />
Sofala 62 51 8 4 20 27 6 3 2 6 0 2 1 1<br />
Inhambane 27 9 11 11 44 53 14 18 0 0 1 2 2 2<br />
Gaza 41 35 16 14 16 35 23 6 0 0 1 2 3 2<br />
Maputo 43 26 10 8 39 54 3 0 0 0 1 2 3 2<br />
Total 38 36 12 12 39 35 6 5 2 4 1 2 2 1<br />
57