- Page 1 and 2:
savremena poljoprivreda CONTEMPORAR
- Page 3 and 4:
YU ISSN 0350-1205 Časopis za poljo
- Page 5 and 6:
UTVRĐIVANJE ISPLATIVOSTI INVESTICI
- Page 8 and 9:
„SAVREMENA POLJOPRIVREDA“ VOL.
- Page 10 and 11:
tratnom smešom sa 16-17% proteina.
- Page 12 and 13:
ta i podaci pokazuju da su njegovi
- Page 14 and 15:
„SAVREMENA POLJOPRIVREDA“ VOL.
- Page 16 and 17:
g/100 g) i laktoze (1.87±0.06 u od
- Page 18 and 19:
Tabela 3. Sastav mleka kod transgen
- Page 20 and 21:
LUKEFAHR S., HOHENBOKEN W.D., CHEEK
- Page 22 and 23:
tu zavisnost između outputa po jed
- Page 24 and 25:
veća zastupljenost stočarske proi
- Page 26 and 27:
MOGUĆE MERE AGRARNE POLITIKE Pre u
- Page 28 and 29:
PEJANOVIĆ, R., TICA, N., VLAHOVIĆ
- Page 30 and 31:
dustrije i koji je u celini nazvan
- Page 32 and 33:
Osnovna šema insineracione peći z
- Page 34 and 35:
The paper presents hazardous waste
- Page 36 and 37:
a dominantni folikul iz 3. talasa,
- Page 38 and 39:
ZAKLJUČAK Na osnovu dobijenih rezu
- Page 40 and 41:
„SAVREMENA POLJOPRIVREDA“ VOL.
- Page 42 and 43:
Tabela 1. Broj živih, mrtvih i odg
- Page 44 and 45:
LITERATURA GERASIMOV, V., PRON, E.,
- Page 46 and 47:
liku otpornost na ove parazite (Pit
- Page 48 and 49:
li četvorostruka razređenja serum
- Page 50 and 51:
SEROPREVALENCE OF TOXOPLASMA GONDII
- Page 52 and 53:
posmatranjem određenih klaničnih
- Page 54 and 55:
Slika 2. Mikrofotografi ja poprečn
- Page 56 and 57:
Histohemijskim ispitivanjima, kod s
- Page 58 and 59:
„SAVREMENA POLJOPRIVREDA“ VOL.
- Page 60 and 61:
njihovih interesa. Tu su, pre svega
- Page 62 and 63:
za iznalaženje stalno novih oblika
- Page 64 and 65:
„SAVREMENA POLJOPRIVREDA“ VOL.
- Page 66 and 67:
Najveći deo troškova materijala
- Page 68 and 69:
troškove uzgoja kvalitet tovljenik
- Page 70 and 71:
udaljena 30 godina, ukažu na proiz
- Page 72 and 73:
Proizvodni pokazatelji u ovčarstvu
- Page 74 and 75:
Analize pokazuju da je učešće ž
- Page 76 and 77:
PRODUCTION INDICATORS OF ANIMAL HUS
- Page 78 and 79:
IZVORI PODATAKA I METODOLOGIJA RADA
- Page 80 and 81:
sl., kao i fi zičko-hemijskim, odn
- Page 82 and 83:
đevina i uskladiti ih sa svetskim
- Page 84 and 85:
„SAVREMENA POLJOPRIVREDA“ VOL.
- Page 86 and 87:
3. Rok (period) povraćaja uloženi
- Page 88 and 89:
Izračunata prinosna vrednost zasad
- Page 90 and 91:
ZAKLJUČAK Za utvrđivanje ekonomsk
- Page 92 and 93:
„SAVREMENA POLJOPRIVREDA“ VOL.
- Page 94 and 95:
mijskim analizama je predhodilo usi
- Page 96 and 97:
tranih godina uočene su statistič
- Page 98 and 99:
„SAVREMENA POLJOPRIVREDA“ VOL.
- Page 100 and 101:
Slika 1: Disperzija izvoza životin
- Page 102 and 103:
gnjećeg i junećeg mesa. Dobijanje
- Page 104 and 105:
LITERATURA BOŠNJAK DANICA, RODIĆ
- Page 106 and 107:
herodon i Oreochromis (Neotilapia)
- Page 108 and 109:
snoj masi do 30g. U suptropskim i t
- Page 110 and 111:
nosno ukupno 284 kg, prosečne koma
- Page 112 and 113:
„SAVREMENA POLJOPRIVREDA“ VOL.
- Page 114 and 115:
ataka i karabataka i abdominalne ma
- Page 116 and 117:
LITERATURA BOŽIĆ, A.: Uticaj pore
- Page 118 and 119:
„SAVREMENA POLJOPRIVREDA“ VOL.
- Page 120 and 121:
- it infl uences juice losses at me
- Page 122 and 123:
Table 5. Chemical content of the me
- Page 124 and 125:
„SAVREMENA POLJOPRIVREDA“ VOL.
- Page 126 and 127:
Rod Clavibacter Davis et al. 1984 Z
- Page 128 and 129:
Rod Samsonia gen.nov. Samsonia eryt
- Page 130 and 131:
NEW CHANGES IN TAXONOMY AND NOMENCL
- Page 132 and 133:
MATERIJAL I METODA RADA Ispitivanja
- Page 134 and 135:
Tabela 2. Morfološke karakteristik
- Page 136 and 137:
statistički vrlo značajna razlika
- Page 138 and 139:
„SAVREMENA POLJOPRIVREDA“ VOL.
- Page 140 and 141:
RESULTS AND DISCUSSION Table 1. Mil
- Page 142 and 143:
CHRENEK P., VAŠÍČEK D., MAKAREVI
- Page 144 and 145:
proizvodne tehnologije (infrastrukt
- Page 146 and 147:
SV K = SV T = n t= 1 1 n t= 1 1 K
- Page 148 and 149:
i informaciono zahtevna i zbog toga
- Page 150 and 151:
„SAVREMENA POLJOPRIVREDA“ VOL.
- Page 152 and 153:
Table 1. Productive traits, feed in
- Page 154 and 155:
„SAVREMENA POLJOPRIVREDA“ VOL.
- Page 156 and 157:
ovog rada, gde su nazimice dve najs
- Page 158 and 159:
LITERATURA CLARC, L.K. LEMAN, A.D.:
- Page 160 and 161:
MATERIJAL I METODE RADA Istraživan
- Page 162 and 163:
Kofein dovodi do ekscitacije letarg
- Page 164 and 165:
2. Zamrzavanje na temperaturi od-80
- Page 166 and 167:
INFLUENCE PROSTAGLANDINS POSTPARTUM
- Page 168 and 169:
ion, fetus i mladi organizmi mogu l
- Page 170 and 171:
gornje fi ziološke vrednosti aktiv
- Page 172 and 173:
JACQUES, K.A.: Selenium metabolism
- Page 174 and 175:
navedenim slučajevima konverzija u
- Page 176 and 177:
Rezultati su pokazali da je, kod ve
- Page 178 and 179:
„SAVREMENA POLJOPRIVREDA“ VOL.
- Page 180 and 181: veća za 2%. Lević i sar. (1997) i
- Page 182 and 183: ovinskog sastava (0,80 i 0,57% ukup
- Page 184 and 185: 3. korišćenje fi taze u cilju pov
- Page 186 and 187: RAMA RAO, S.V., RAMASUBBA REDDY, V.
- Page 188 and 189: PHYTASE IN BROILERS NUTRITION (A RE
- Page 190 and 191: MATERIJAL I METODE RADA Istraživan
- Page 192 and 193: adnog vremena. Cooper (1981) navodi
- Page 194 and 195: 3. u toku radnog vremena oprasilo s
- Page 196 and 197: trajanja ovog stanja određuje se i
- Page 198 and 199: Tab. 3. Uticaj načina držanja i t
- Page 200 and 201: TAUSON, R.: Technical changes in ca
- Page 202 and 203: Cilj rada bio je da se ustanove efe
- Page 204 and 205: Tabela 3.Postlaktacijsko estrusno r
- Page 206 and 207: Zapaljenje mliječne žlijezde, aga
- Page 208 and 209: „SAVREMENA POLJOPRIVREDA“ VOL.
- Page 210 and 211: Tabela 1. Spoljašnje osobine kvali
- Page 212 and 213: Na kraju se može zaključiti da su
- Page 214 and 215: „SAVREMENA POLJOPRIVREDA“ VOL.
- Page 216 and 217: REZULTATI Defi nisanje hromatografs
- Page 218 and 219: Vrednosti prinosa ekstrakcije dobij
- Page 220 and 221: „SAVREMENA POLJOPRIVREDA“ VOL.
- Page 222 and 223: Tabela 1. Telesna masa i prirast fa
- Page 224 and 225: Tabela 3. Mortalitet fazana (%) Tab
- Page 226 and 227: „SAVREMENA POLJOPRIVREDA“ VOL.
- Page 228 and 229: Table 1.The experimental scheme Per
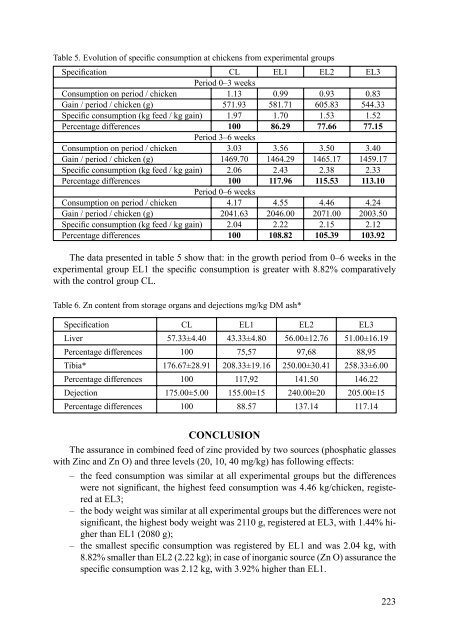
- Page 232 and 233: EFEKAT IZVORA I NIVOA CINKA NA SADR
- Page 234 and 235: koji se ogleda u tome da jedinke vr
- Page 236 and 237: Rezultati metode atraktivnih placeb
- Page 238 and 239: UPUTSTVO AUTORIMA ZA PISANJE RADOVA
- Page 240 and 241: INTRODUCTIONS TO AUTHORS ON WRITING