download pdf - Institut für Umweltphysik - Ruprecht-Karls-Universität ...
download pdf - Institut für Umweltphysik - Ruprecht-Karls-Universität ...
download pdf - Institut für Umweltphysik - Ruprecht-Karls-Universität ...

Create successful ePaper yourself
Turn your PDF publications into a flip-book with our unique Google optimized e-Paper software.
66 CHAPTER 2. ATMOSPHERE AND REMOTE SENSING<br />
2.4.8 Satellite observations of global water vapor trends 1996 - 2003<br />
Thomas Wagner<br />
Abstract From modern UV/vis satellite instruments, the integrated water vapor concentration<br />
(often referred to as vertical column density or total column precipitable water) can be observed on<br />
a global scale. In contrast to previous satellite observations in the infrared and microwave spectral<br />
range our observations include both ocean and land surfaces with similar sensitivity.<br />
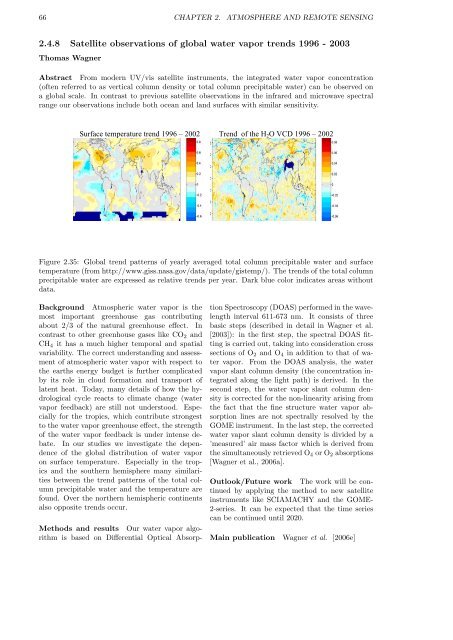
Surface temperature trend 1996 – 2002 Trend of the H2O VCD 1996 – 2002<br />
Figure 2.35: Global trend patterns of yearly averaged total column precipitable water and surface<br />
temperature (from http://www.giss.nasa.gov/data/update/gistemp/). The trends of the total column<br />
precipitable water are expressed as relative trends per year. Dark blue color indicates areas without<br />
data.<br />
Background Atmospheric water vapor is the<br />
most important greenhouse gas contributing<br />
about 2/3 of the natural greenhouse effect. In<br />
contrast to other greenhouse gases like CO2 and<br />
CH4 it has a much higher temporal and spatial<br />
variability. The correct understanding and assessment<br />
of atmospheric water vapor with respect to<br />
the earths energy budget is further complicated<br />
by its role in cloud formation and transport of<br />
latent heat. Today, many details of how the hydrological<br />
cycle reacts to climate change (water<br />
vapor feedback) are still not understood. Especially<br />
for the tropics, which contribute strongest<br />
to the water vapor greenhouse effect, the strength<br />
of the water vapor feedback is under intense debate.<br />
In our studies we investigate the dependence<br />
of the global distribution of water vapor<br />
on surface temperature. Especially in the tropics<br />
and the southern hemisphere many similarities<br />
between the trend patterns of the total column<br />
precipitable water and the temperature are<br />
found. Over the northern hemispheric continents<br />
also opposite trends occur.<br />
Methods and results Our water vapor algorithm<br />
is based on Differential Optical Absorp-<br />
tion Spectroscopy (DOAS) performed in the wavelength<br />
interval 611-673 nm. It consists of three<br />
basic steps (described in detail in Wagner et al.<br />
[2003]): in the first step, the spectral DOAS fitting<br />
is carried out, taking into consideration cross<br />
sections of O2 and O4 in addition to that of water<br />
vapor. From the DOAS analysis, the water<br />
vapor slant column density (the concentration integrated<br />
along the light path) is derived. In the<br />
second step, the water vapor slant column density<br />
is corrected for the non-linearity arising from<br />
the fact that the fine structure water vapor absorption<br />
lines are not spectrally resolved by the<br />
GOME instrument. In the last step, the corrected<br />
water vapor slant column density is divided by a<br />
’measured’ air mass factor which is derived from<br />
the simultaneously retrieved O4 or O2 absorptions<br />
[Wagner et al., 2006a].<br />
Outlook/Future work The work will be continued<br />
by applying the method to new satellite<br />
instruments like SCIAMACHY and the GOME-<br />
2-series. It can be expected that the time series<br />
can be continued until 2020.<br />
Main publication Wagner et al. [2006e]