

UN World Investment Report 2010 - Office of Trade Negotiations
UN World Investment Report 2010 - Office of Trade Negotiations
UN World Investment Report 2010 - Office of Trade Negotiations

Create successful ePaper yourself
Turn your PDF publications into a flip-book with our unique Google optimized e-Paper software.
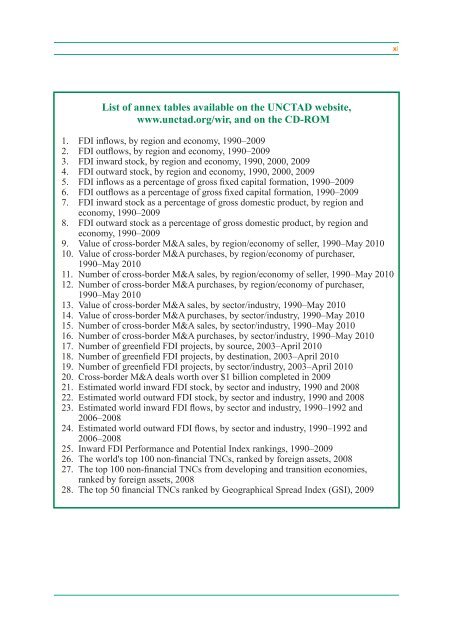
List <strong>of</strong> annex tables available on the <strong>UN</strong>CTAD website,<br />
www.unctad.org/wir, and on the CD-ROM<br />
1. FDI inflows, by region and economy, 1990–2009<br />
2. FDI outflows, by region and economy, 1990–2009<br />
3. FDI inward stock, by region and economy, 1990, 2000, 2009<br />
4. FDI outward stock, by region and economy, 1990, 2000, 2009<br />
5. FDI inflows as a percentage <strong>of</strong> gross fixed capital formation, 1990–2009<br />
6. FDI outflows as a percentage <strong>of</strong> gross fixed capital formation, 1990–2009<br />
7. FDI inward stock as a percentage <strong>of</strong> gross domestic product, by region and<br />
economy, 1990–2009<br />
8. FDI outward stock as a percentage <strong>of</strong> gross domestic product, by region and<br />
economy, 1990–2009<br />
9. Value <strong>of</strong> cross-border M&A sales, by region/economy <strong>of</strong> seller, 1990–May <strong>2010</strong><br />
10. Value <strong>of</strong> cross-border M&A purchases, by region/economy <strong>of</strong> purchaser,<br />
1990–May <strong>2010</strong><br />
11. Number <strong>of</strong> cross-border M&A sales, by region/economy <strong>of</strong> seller, 1990–May <strong>2010</strong><br />
12. Number <strong>of</strong> cross-border M&A purchases, by region/economy <strong>of</strong> purchaser,<br />
1990–May <strong>2010</strong><br />
13. Value <strong>of</strong> cross-border M&A sales, by sector/industry, 1990–May <strong>2010</strong><br />
14. Value <strong>of</strong> cross-border M&A purchases, by sector/industry, 1990–May <strong>2010</strong><br />
15. Number <strong>of</strong> cross-border M&A sales, by sector/industry, 1990–May <strong>2010</strong><br />
16. Number <strong>of</strong> cross-border M&A purchases, by sector/industry, 1990–May <strong>2010</strong><br />
17. Number <strong>of</strong> greenfield FDI projects, by source, 2003–April <strong>2010</strong><br />
18. Number <strong>of</strong> greenfield FDI projects, by destination, 2003–April <strong>2010</strong><br />
19. Number <strong>of</strong> greenfield FDI projects, by sector/industry, 2003–April <strong>2010</strong><br />
20. Cross-border M&A deals worth over $1 billion completed in 2009<br />
21. Estimated world inward FDI stock, by sector and industry, 1990 and 2008<br />
22. Estimated world outward FDI stock, by sector and industry, 1990 and 2008<br />
23. Estimated world inward FDI flows, by sector and industry, 1990–1992 and<br />
2006–2008<br />
24. Estimated world outward FDI flows, by sector and industry, 1990–1992 and<br />
2006–2008<br />
25. Inward FDI Performance and Potential Index rankings, 1990–2009<br />
26. The world's top 100 non-financial TNCs, ranked by foreign assets, 2008<br />
27. The top 100 non-financial TNCs from developing and transition economies,<br />
ranked by foreign assets, 2008<br />
28. The top 50 financial TNCs ranked by Geographical Spread Index (GSI), 2009<br />
xi


