

UN World Investment Report 2010 - Office of Trade Negotiations
UN World Investment Report 2010 - Office of Trade Negotiations
UN World Investment Report 2010 - Office of Trade Negotiations

You also want an ePaper? Increase the reach of your titles
YUMPU automatically turns print PDFs into web optimized ePapers that Google loves.
CHAPTER I Global Trends in FDI 7<br />
12 trillion yen ($133 billion) higher than<br />
the previous year, but they still remained<br />
40 per cent lower than at their 2008 peak.<br />
A similar trend can be observed in emerging<br />
economies. For example, the operating<br />
Box I.2. Outward FDI from the BRIC countries<br />
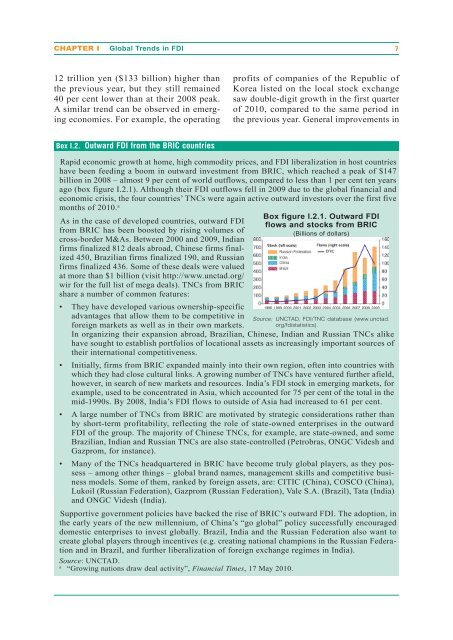
Rapid economic growth at home, high commodity prices, and FDI liberalization in host countries<br />
have been feeding a boom in outward investment from BRIC, which reached a peak <strong>of</strong> $147<br />
billion in 2008 – almost 9 per cent <strong>of</strong> world outflows, compared to less than 1 per cent ten years<br />
ago (box figure I.2.1). Although their FDI outflows fell in 2009 due to the global financial and<br />
economic crisis, the four countries’ TNCs were again active outward investors over the first five<br />
months <strong>of</strong> <strong>2010</strong>. a<br />
As in the case <strong>of</strong> developed countries, outward FDI<br />
from BRIC has been boosted by rising volumes <strong>of</strong><br />
cross-border M&As. Between 2000 and 2009, Indian<br />
firms finalized 812 deals abroad, Chinese firms finalized<br />
450, Brazilian firms finalized 190, and Russian<br />
firms finalized 436. Some <strong>of</strong> these deals were valued<br />
at more than $1 billion (visit http://www.unctad.org/<br />
wir for the full list <strong>of</strong> mega deals). TNCs from BRIC<br />
share a number <strong>of</strong> common features:<br />
•<br />
•<br />
•<br />
•<br />
They have developed various ownership-specific<br />
advantages that allow them to be competitive in<br />
foreign markets as well as in their own markets.<br />
pr<strong>of</strong>its <strong>of</strong> companies <strong>of</strong> the Republic <strong>of</strong><br />
Korea listed on the local stock exchange<br />
saw double-digit growth in the first quarter<br />
<strong>of</strong> <strong>2010</strong>, compared to the same period in<br />
the previous year. General improvements in<br />
Box figure I.2.1. Outward FDI<br />
flows and stocks from BRIC<br />
(Billions <strong>of</strong> dollars)<br />
Source: <strong>UN</strong>CTAD, FDI/TNC database (www.unctad.<br />
org/fdistatistics).<br />
In organizing their expansion abroad, Brazilian, Chinese, Indian and Russian TNCs alike<br />
have sought to establish portfolios <strong>of</strong> locational assets as increasingly important sources <strong>of</strong><br />
their international competitiveness.<br />
Initially, firms from BRIC expanded mainly into their own region, <strong>of</strong>ten into countries with<br />
which they had close cultural links. A growing number <strong>of</strong> TNCs have ventured further afield,<br />
however, in search <strong>of</strong> new markets and resources. India’s FDI stock in emerging markets, for<br />
example, used to be concentrated in Asia, which accounted for 75 per cent <strong>of</strong> the total in the<br />
mid-1990s. By 2008, India’s FDI flows to outside <strong>of</strong> Asia had increased to 61 per cent.<br />
A large number <strong>of</strong> TNCs from BRIC are motivated by strategic considerations rather than<br />
by short-term pr<strong>of</strong>itability, reflecting the role <strong>of</strong> state-owned enterprises in the outward<br />
FDI <strong>of</strong> the group. The majority <strong>of</strong> Chinese TNCs, for example, are state-owned, and some<br />
Brazilian, Indian and Russian TNCs are also state-controlled (Petrobras, ONGC Videsh and<br />
Gazprom, for instance).<br />
Many <strong>of</strong> the TNCs headquartered in BRIC have become truly global players, as they possess<br />
– among other things – global brand names, management skills and competitive business<br />
models. Some <strong>of</strong> them, ranked by foreign assets, are: CITIC (China), COSCO (China),<br />
Lukoil (Russian Federation), Gazprom (Russian Federation), Vale S.A. (Brazil), Tata (India)<br />
and ONGC Videsh (India).<br />
Supportive government policies have backed the rise <strong>of</strong> BRIC’s outward FDI. The adoption, in<br />
the early years <strong>of</strong> the new millennium, <strong>of</strong> China’s “go global” policy successfully encouraged<br />
domestic enterprises to invest globally. Brazil, India and the Russian Federation also want to<br />
create global players through incentives (e.g. creating national champions in the Russian Federation<br />
and in Brazil, and further liberalization <strong>of</strong> foreign exchange regimes in India).<br />
Source: <strong>UN</strong>CTAD.<br />
a “Growing nations draw deal activity”, Financial Times, 17 May <strong>2010</strong>.


