

UN World Investment Report 2010 - Office of Trade Negotiations
UN World Investment Report 2010 - Office of Trade Negotiations
UN World Investment Report 2010 - Office of Trade Negotiations

Create successful ePaper yourself
Turn your PDF publications into a flip-book with our unique Google optimized e-Paper software.
CHAPTER I Global Trends in FDI 15<br />
centrated on developed countries in North<br />
America and the EU. In 2009 and the first<br />
five months <strong>of</strong> <strong>2010</strong>, SWFs increased their<br />
FDI in Asia, 25 which had been much less<br />
affected by the financial market crisis and<br />
the economic downturn.<br />
SWFs’ investment prospects are also influenced<br />
by other considerations. Their growing<br />
foreign investment activities have raised<br />
concerns that they could be a possible threat<br />
to national security and to the market-based<br />
economies <strong>of</strong> host developed countries.<br />
Some recipient countries have tightened their<br />
investment regimes, or otherwise regulated<br />
FDI (chapter III). 26 SWFs have responded<br />
by making efforts to improve transparency,<br />
by adopting a set <strong>of</strong> rules known as the<br />
Santiago Principles. A study <strong>of</strong> the 10 largest<br />
SWFs carried out by RiskMetrics found<br />
that they fully complied with a total <strong>of</strong> 60<br />
per cent <strong>of</strong> these Principles (RiskMetrics,<br />
2009). This could help reduce concerns in<br />
host countries about the implications <strong>of</strong> their<br />
investments.<br />
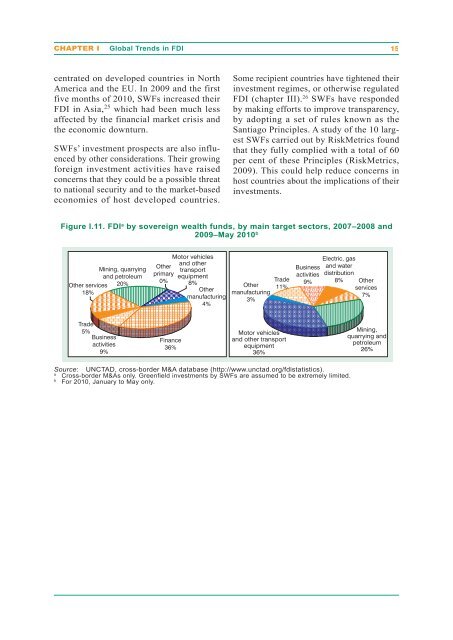
Figure I.11. FDI a by sovereign wealth funds, by main target sectors, 2007–2008 and<br />
2009–May <strong>2010</strong> b<br />
Other services<br />
18%<br />
<strong>Trade</strong><br />
5% Business<br />
activities<br />
9%<br />
Mining, quarrying<br />
and petroleum<br />
20%<br />
Other<br />
primary<br />
0%<br />
Finance<br />
36%<br />
Motor vehicles<br />
and other<br />
transport<br />
equipment<br />
8%<br />
Other<br />
manufacturing<br />
4%<br />
Other<br />
manufacturing<br />
3%<br />
<strong>Trade</strong><br />
11%<br />
Motor vehicles<br />
and other transport<br />
equipment<br />
36%<br />
Business<br />
activities<br />
9%<br />
Electric, gas<br />
and water<br />
distribution<br />
8% Other<br />
services<br />
7%<br />
Source: <strong>UN</strong>CTAD, cross-border M&A database (http://www.unctad.org/fdistatistics).<br />
a Cross-border M&As only. Greenfield investments by SWFs are assumed to be extremely limited.<br />
b For <strong>2010</strong>, January to May only.<br />
Mining,<br />
quarrying and<br />
petroleum<br />
26%


