

UN World Investment Report 2010 - Office of Trade Negotiations
UN World Investment Report 2010 - Office of Trade Negotiations
UN World Investment Report 2010 - Office of Trade Negotiations

Create successful ePaper yourself
Turn your PDF publications into a flip-book with our unique Google optimized e-Paper software.
CHAPTER I Global Trends in FDI 13<br />
and Venture Capital Association, 2009). In<br />
addition, the performance <strong>of</strong> the companies<br />
that have been through a leveraged buyout<br />
deteriorated in 2008 and 2009, making new<br />
transactions much less attractive. 16<br />
The downward trend continued in the first<br />
five months <strong>of</strong> <strong>2010</strong>. Both the value and the<br />
number <strong>of</strong> cross-border M&As decreased, by<br />
2 per cent and 36 per cent respectively, compared<br />
to the same period in 2009. Whereas<br />
their cross-border M&As in continental<br />
Europe were still low, private equity firms<br />
increased their investments in North America<br />
and in developing countries in Asia.<br />
A recovery in private equity funds’ FDI<br />
will depend on several factors. A revival<br />
<strong>of</strong> the leveraged buyout market can only<br />
be expected when financial markets have<br />
largely recovered from the crisis and when<br />
banks have further reduced the risk pr<strong>of</strong>iles<br />
<strong>of</strong> their balance sheets. In addition, regula-<br />
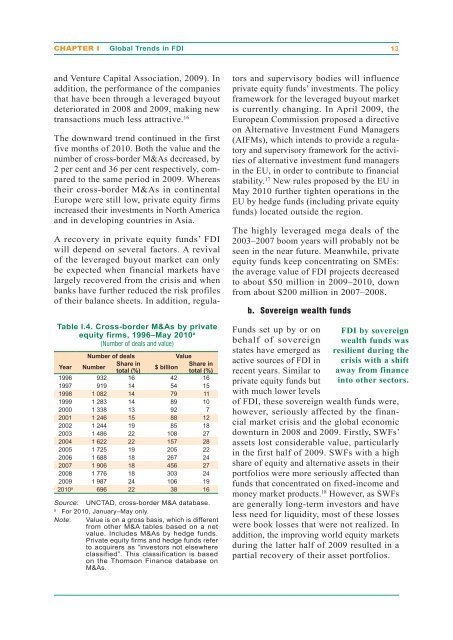
Table I.4. Cross-border M&As by private<br />
equity firms, 1996–May <strong>2010</strong> a<br />
(Number <strong>of</strong> deals and value)<br />
Number <strong>of</strong> deals Value<br />
Year Number<br />
Share in<br />
total (%)<br />
$ billion<br />
Share in<br />
total (%)<br />
1996 932 16 42 16<br />
1997 919 14 54 15<br />
1998 1 082 14 79 11<br />
1999 1 283 14 89 10<br />
2000 1 338 13 92 7<br />
2001 1 246 15 88 12<br />
2002 1 244 19 85 18<br />
2003 1 486 22 108 27<br />
2004 1 622 22 157 28<br />
2005 1 725 19 205 22<br />
2006 1 688 18 267 24<br />
2007 1 906 18 456 27<br />
2008 1 776 18 303 24<br />
2009 1 987 24 106 19<br />
<strong>2010</strong>a 696 22 38 16<br />
Source: <strong>UN</strong>CTAD, cross-border M&A database.<br />
a For <strong>2010</strong>, January–May only.<br />
Note: Value is on a gross basis, which is different<br />
from other M&A tables based on a net<br />
value. Includes M&As by hedge funds.<br />
Private equity firms and hedge funds refer<br />
to acquirers as “investors not elsewhere<br />
classified”. This classification is based<br />
on the Thomson Finance database on<br />
M&As.<br />
tors and supervisory bodies will influence<br />
private equity funds’ investments. The policy<br />
framework for the leveraged buyout market<br />
is currently changing. In April 2009, the<br />
European Commission proposed a directive<br />
on Alternative <strong>Investment</strong> Fund Managers<br />
(AIFMs), which intends to provide a regulatory<br />
and supervisory framework for the activities<br />
<strong>of</strong> alternative investment fund managers<br />
in the EU, in order to contribute to financial<br />
stability. 17 New rules proposed by the EU in<br />
May <strong>2010</strong> further tighten operations in the<br />
EU by hedge funds (including private equity<br />
funds) located outside the region.<br />
The highly leveraged mega deals <strong>of</strong> the<br />
2003–2007 boom years will probably not be<br />
seen in the near future. Meanwhile, private<br />
equity funds keep concentrating on SMEs:<br />
the average value <strong>of</strong> FDI projects decreased<br />
to about $50 million in 2009–<strong>2010</strong>, down<br />
from about $200 million in 2007–2008.<br />
b. Sovereign wealth funds<br />
Funds set up by or on<br />
behalf <strong>of</strong> sovereign<br />
states have emerged as<br />
active sources <strong>of</strong> FDI in<br />
recent years. Similar to<br />
private equity funds but<br />
with much lower levels<br />
<strong>of</strong> FDI, these sovereign wealth funds were,<br />
however, seriously affected by the financial<br />
market crisis and the global economic<br />
downturn in 2008 and 2009. Firstly, SWFs’<br />
assets lost considerable value, particularly<br />
in the first half <strong>of</strong> 2009. SWFs with a high<br />
share <strong>of</strong> equity and alternative assets in their<br />
portfolios were more seriously affected than<br />
funds that concentrated on fixed-income and<br />
money market products. 18 FDI by sovereign<br />
wealth funds was<br />
resilient during the<br />
crisis with a shift<br />
away from finance<br />
into other sectors.<br />
However, as SWFs<br />
are generally long-term investors and have<br />
less need for liquidity, most <strong>of</strong> these losses<br />
were book losses that were not realized. In<br />
addition, the improving world equity markets<br />
during the latter half <strong>of</strong> 2009 resulted in a<br />
partial recovery <strong>of</strong> their asset portfolios.


