

UN World Investment Report 2010 - Office of Trade Negotiations
UN World Investment Report 2010 - Office of Trade Negotiations
UN World Investment Report 2010 - Office of Trade Negotiations

Create successful ePaper yourself
Turn your PDF publications into a flip-book with our unique Google optimized e-Paper software.
CHAPTER I Global Trends in FDI 17<br />
I.5). This relative resilience might be explained<br />
by the fact that foreign sales started<br />
to pick up again in the latter half <strong>of</strong> 2009.<br />
In addition, many TNCs are thought to have<br />
slowed their downsizing programmes as<br />
economic activity rebounded – especially<br />
in developing Asia. In spite <strong>of</strong> the setback<br />
in 2008 and 2009, an estimated 80 million<br />
workers were employed in TNCs’ foreign<br />
affiliates in 2009, accounting for about 4<br />
per cent <strong>of</strong> the global workforce.<br />
Dynamics vary across countries and sectors,<br />
but employment in foreign affiliates has been<br />
shifting from developed to developing countries<br />
over the past few years (chapter II); the<br />
majority <strong>of</strong> foreign affiliates’ employment<br />
is now located in developing economies. 28<br />
The largest number <strong>of</strong> foreign-affiliate employees<br />
is now in China (with 16 million<br />
workers in 2008, accounting for some 20<br />
per cent <strong>of</strong> the world’s total employees in<br />
foreign affiliates). Employment in foreign<br />
affiliates in the United States, on the other<br />
hand, shrank by half a million between 2001<br />
and 2008.<br />
In addition, the share <strong>of</strong> foreign affiliates’<br />
employment in manufacturing has declined<br />
in favour <strong>of</strong> services. In developed countries,<br />
employment in foreign affiliates in the manufacturing<br />
sector dropped sharply between<br />
1999 and 2007, while in services it gained<br />
importance as a result <strong>of</strong> structural changes<br />
in the economies (OECD, <strong>2010</strong>).<br />
Foreign affiliates’ assets grew at a rate <strong>of</strong><br />
7.5 per cent in 2009. The increase is largely<br />
attributable to the 15 per cent rise in inward<br />
FDI stock due to a significant rebound on<br />
the global stock markets (section A).<br />
The regional shift in international production<br />
is also reflected in the TNC landscape.<br />
Although the composition <strong>of</strong> the world’s top<br />
100 TNCs confirms that the triad countries<br />
remain dominant, their share has been slowly<br />
decreasing over the years. Developing and<br />
transition-economy TNCs now occupy seven<br />
positions among the top 100. And while<br />
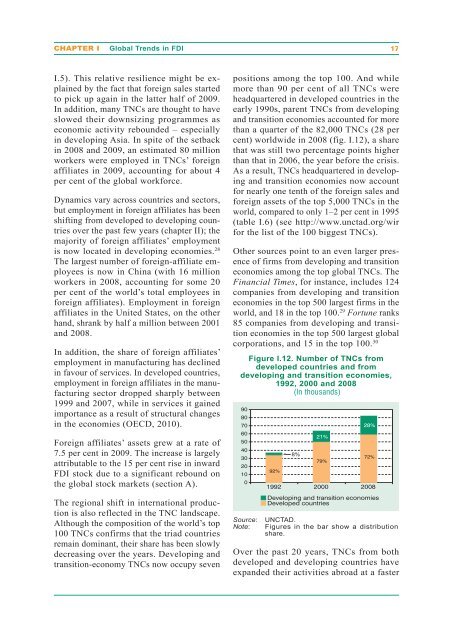
more than 90 per cent <strong>of</strong> all TNCs were<br />
headquartered in developed countries in the<br />
early 1990s, parent TNCs from developing<br />
and transition economies accounted for more<br />
than a quarter <strong>of</strong> the 82,000 TNCs (28 per<br />
cent) worldwide in 2008 (fig. I.12), a share<br />
that was still two percentage points higher<br />
than that in 2006, the year before the crisis.<br />
As a result, TNCs headquartered in developing<br />
and transition economies now account<br />
for nearly one tenth <strong>of</strong> the foreign sales and<br />
foreign assets <strong>of</strong> the top 5,000 TNCs in the<br />
world, compared to only 1–2 per cent in 1995<br />
(table I.6) (see http://www.unctad.org/wir<br />
for the list <strong>of</strong> the 100 biggest TNCs).<br />
Other sources point to an even larger presence<br />
<strong>of</strong> firms from developing and transition<br />
economies among the top global TNCs. The<br />
Financial Times, for instance, includes 124<br />
companies from developing and transition<br />
economies in the top 500 largest firms in the<br />
world, and 18 in the top 100. 29 Fortune ranks<br />
85 companies from developing and transition<br />
economies in the top 500 largest global<br />
corporations, and 15 in the top 100. 30<br />
Figure I.12. Number <strong>of</strong> TNCs from<br />
developed countries and from<br />
developing and transition economies,<br />
1992, 2000 and 2008<br />
(In thousands)<br />
90<br />
80<br />
70<br />
60<br />
50<br />
40<br />
30<br />
20<br />
10<br />
0<br />
92%<br />
8%<br />
21%<br />
79%<br />
28%<br />
72%<br />
1992 2000 2008<br />
Developing and transition economies<br />
Developed countries<br />
Source: <strong>UN</strong>CTAD.<br />
Note: Figures in the bar show a distribution<br />
share.<br />
Over the past 20 years, TNCs from both<br />
developed and developing countries have<br />
expanded their activities abroad at a faster


