

UN World Investment Report 2010 - Office of Trade Negotiations
UN World Investment Report 2010 - Office of Trade Negotiations
UN World Investment Report 2010 - Office of Trade Negotiations

Create successful ePaper yourself
Turn your PDF publications into a flip-book with our unique Google optimized e-Paper software.
16<br />
The economic and<br />
financial crisis has<br />
significantly affected<br />
TNCs’ operations<br />
abroad. 27<br />
FDI stock and assets<br />
continued to increase<br />
despite the toll taken<br />
by the crisis on TNCs’<br />
sales and value-added.<br />
The share <strong>of</strong> developingcountry<br />
TNCs in global<br />
production is growing.<br />
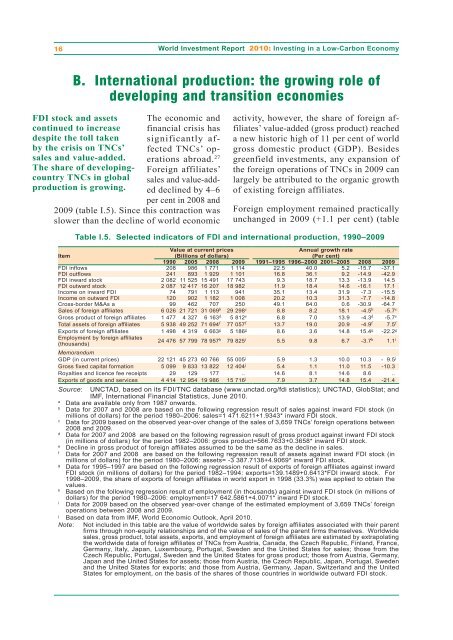
Foreign affiliates’<br />
sales and value-added<br />
declined by 4–6<br />
per cent in 2008 and<br />
2009 (table I.5). Since this contraction was<br />
slower than the decline <strong>of</strong> world economic<br />
<strong>World</strong> <strong>Investment</strong> <strong>Report</strong> <strong>2010</strong>: Investing in a Low-Carbon Economy<br />
B. International production: the growing role <strong>of</strong><br />
developing and transition economies<br />
activity, however, the share <strong>of</strong> foreign affiliates’<br />
value-added (gross product) reached<br />
a new historic high <strong>of</strong> 11 per cent <strong>of</strong> world<br />
gross domestic product (GDP). Besides<br />
greenfield investments, any expansion <strong>of</strong><br />
the foreign operations <strong>of</strong> TNCs in 2009 can<br />
largely be attributed to the organic growth<br />
<strong>of</strong> existing foreign affiliates.<br />
Foreign employment remained practically<br />
unchanged in 2009 (+1.1 per cent) (table<br />
Table I.5. Selected indicators <strong>of</strong> FDI and international production, 1990–2009<br />
Value at current prices Annual growth rate<br />
Item<br />
(Billions <strong>of</strong> dollars) (Per cent)<br />
1990 2005 2008 2009 1991–1995 1996–2000 2001–2005 2008 2009<br />
FDI inflows 208 986 1 771 1 114 22.5 40.0 5.2 -15.7 -37.1<br />
FDI outflows 241 893 1 929 1 101 16.8 36.1 9.2 -14.9 -42.9<br />
FDI inward stock 2 082 11 525 15 491 17 743 9.3 18.7 13.3 -13.9 14.5<br />
FDI outward stock 2 087 12 417 16 207 18 982 11.9 18.4 14.6 -16.1 17.1<br />
Income on inward FDI 74 791 1 113 941 35.1 13.4 31.9 -7.3 -15.5<br />
Income on outward FDI 120 902 1 182 1 008 20.2 10.3 31.3 -7.7 -14.8<br />
Cross-border M&As a 99 462 707 250 49.1 64.0 0.6 -30.9 -64.7<br />
Sales <strong>of</strong> foreign affiliates 6 026 21 721 31 069b 29 298c 8.8 8.2 18.1 -4.5b -5.7c Gross product <strong>of</strong> foreign affiliates 1 477 4 327 6 163d 5 812e 6.8 7.0 13.9 -4.3d -5.7e Total assets <strong>of</strong> foreign affiliates 5 938 49 252 71 694f 77 057f 13.7 19.0 20.9 -4.9f 7.5f Exports <strong>of</strong> foreign affiliates 1 498 4 319 6 663g 5 186 g 8.6 3.6 14.8 15.4g -22.2g Employment by foreign affiliates<br />
(thousands)<br />
24 476 57 799 78 957h 79 825i 5.5 9.8 6.7 -3.7h 1.1i Memorandum<br />
GDP (in current prices) 22 121 45 273 60 766 55 005 j 5.9 1.3 10.0 10.3 - 9.5 j<br />
Gross fixed capital formation 5 099 9 833 13 822 12 404 j 5.4 1.1 11.0 11.5 -10.3<br />
Royalties and licence fee receipts 29 129 177 .. 14.6 8.1 14.6 8.6 ..<br />
Exports <strong>of</strong> goods and services 4 414 12 954 19 986 15 716 j 7.9 3.7 14.8 15.4 -21.4<br />
Source: <strong>UN</strong>CTAD, based on its FDI/TNC database (www.unctad.org/fdi statistics); <strong>UN</strong>CTAD, GlobStat; and<br />
IMF, International Financial Statistics, June <strong>2010</strong>.<br />
a Data are available only from 1987 onwards.<br />
b Data for 2007 and 2008 are based on the following regression result <strong>of</strong> sales against inward FDI stock (in<br />
millions <strong>of</strong> dollars) for the period 1980–2006: sales=1 471.6211+1.9343* inward FDI stock.<br />
c Data for 2009 based on the observed year-over change <strong>of</strong> the sales <strong>of</strong> 3,659 TNCs’ foreign operations between<br />
2008 and 2009.<br />
d Data for 2007 and 2008 are based on the following regression result <strong>of</strong> gross product against inward FDI stock<br />
(in millions <strong>of</strong> dollars) for the period 1982–2006: gross product=566.7633+0.3658* inward FDI stock.<br />
e Decline in gross product <strong>of</strong> foreign affiliates assumed to be the same as the decline in sales.<br />
f Data for 2007 and 2008 are based on the following regression result <strong>of</strong> assets against inward FDI stock (in<br />
millions <strong>of</strong> dollars) for the period 1980–2006: assets= -3 387.7138+4.9069* inward FDI stock.<br />
g Data for 1995–1997 are based on the following regression result <strong>of</strong> exports <strong>of</strong> foreign affiliates against inward<br />
FDI stock (in millions <strong>of</strong> dollars) for the period 1982–1994: exports=139.1489+0.6413*FDI inward stock. For<br />
1998–2009, the share <strong>of</strong> exports <strong>of</strong> foreign affiliates in world export in 1998 (33.3%) was applied to obtain the<br />
values.<br />
h Based on the following regression result <strong>of</strong> employment (in thousands) against inward FDI stock (in millions <strong>of</strong><br />
dollars) for the period 1980–2006: employment=17 642.5861+4.0071* inward FDI stock.<br />
i Data for 2009 based on the observed year-over change <strong>of</strong> the estimated employment <strong>of</strong> 3,659 TNCs’ foreign<br />
operations between 2008 and 2009.<br />
j Based on data from IMF, <strong>World</strong> Economic Outlook, April <strong>2010</strong>.<br />
Note: Not included in this table are the value <strong>of</strong> worldwide sales by foreign affiliates associated with their parent<br />
firms through non-equity relationships and <strong>of</strong> the value <strong>of</strong> sales <strong>of</strong> the parent firms themselves. <strong>World</strong>wide<br />
sales, gross product, total assets, exports, and employment <strong>of</strong> foreign affiliates are estimated by extrapolating<br />
the worldwide data <strong>of</strong> foreign affiliates <strong>of</strong> TNCs from Austria, Canada, the Czech Republic, Finland, France,<br />
Germany, Italy, Japan, Luxembourg, Portugal, Sweden and the United States for sales; those from the<br />
Czech Republic, Portugal, Sweden and the United States for gross product; those from Austria, Germany,<br />
Japan and the United States for assets; those from Austria, the Czech Republic, Japan, Portugal, Sweden<br />
and the United States for exports; and those from Austria, Germany, Japan, Switzerland and the United<br />
States for employment, on the basis <strong>of</strong> the shares <strong>of</strong> those countries in worldwide outward FDI stock.


