

UN World Investment Report 2010 - Office of Trade Negotiations
UN World Investment Report 2010 - Office of Trade Negotiations
UN World Investment Report 2010 - Office of Trade Negotiations

Create successful ePaper yourself
Turn your PDF publications into a flip-book with our unique Google optimized e-Paper software.
32<br />
1. Developing countries<br />
a. Africa<br />
(i) Recent trends<br />
Table A. Distribution <strong>of</strong> FDI flows among<br />
economies, by range, a 2009<br />
Range Inflows Outflows<br />
Above Angola, Egypt, Nigeria, South<br />
$3.0 billion Africa and Sudan<br />
$2.0 to Algeria, Libyan Arab<br />
$2.9 billion Jamahiriya and Congo<br />
$1.0 to Tunisia, Ghana, Equatorial South Africa and Libyan Arab<br />
$1.9 billion Guinea and Morocco<br />
Zambia, Democratic Republic<br />
Jamahiriya<br />
$0.5 to<br />
$0.9 billion<br />
<strong>of</strong> the Congo, Mozambique,<br />
Uganda, Niger, United<br />
Republic <strong>of</strong> Tanzania,<br />
Madagascar and Namibia<br />
Chad, Côte d’ Ivoire, Liberia,<br />
Egypt<br />
$0.2 to<br />
$0.4 billion<br />
Cameroon, Mauritius,<br />
Seychelles, Botswana and<br />
Senegal<br />
Morocco, Liberia and Algeria<br />
Burkina Faso, Guinea, Kenya, Nigeria, Gabon, Tunisia, Kenya,<br />
Cape Verde, Rwanda, Mali, Sudan, Mauritius, Democratic<br />
Somalia, Djibouti, Ethiopia, Republic <strong>of</strong> the Congo,<br />
Benin, Swaziland, Malawi, Senegal, Rwanda, Niger,<br />
Below $0.1<br />
billion<br />
Zimbabwe, Togo, Lesotho,<br />
Gambia, Central African<br />
Republic, São Tomé and<br />
Angola, Ghana, Seychelles,<br />
São Tomé and Principe, Mali,<br />
Botswana, Mozambique,<br />
Principe, Sierra Leone, Malawi, Burkina Faso, Guinea-<br />
Gabon, Guinea-Bissau, Bissau, Zimbabwe, Cape Verde,<br />
Burundi, Comoros, Eritrea Namibia, Benin, Côte d’ Ivoire,<br />
and Mauritania Swaziland, Cameroon and Togo<br />
a Economies are listed according to the magnitude <strong>of</strong> their FDI<br />
flows.<br />
$ billion<br />
75<br />
70<br />
65<br />
60<br />
55<br />
50<br />
45<br />
40<br />
35<br />
30<br />
25<br />
20<br />
15<br />
10<br />
5<br />
0<br />
Table D. Cross-border M&As by industry, 2008–2009<br />
(Millions <strong>of</strong> dollars)<br />
Sales Purchases<br />
Sector/Industry 2008 2009 2008 2009<br />
Total 21 193 5 140 8 216 2 702<br />
Primary -2 055 2 579 - 133 621<br />
Mining, quarrying and petroleum -2 055 2 579 - 133 621<br />
Manufacturing 15 639 - 110 1 645 138<br />
Food, beverages and tobacco - - - 39<br />
Textiles, clothing and leather - - 7 -<br />
Wood and wood products - 11 1 082 -<br />
Publishing and printing - 4 - - 4 -<br />
Chemicals and chemical products 21 - 620 153 -<br />
Non-metallic mineral products 15 469 250 340 - 4<br />
Metals and metal products 104 248 - 102<br />
Services 7 609 2 672 6 704 1 942<br />
<strong>Trade</strong> 37 - - - 1<br />
Hotels and restaurants 4 - 117 - 3<br />
Transport, storage and communications 1 665 3 058 4 -<br />
Finance 5 613 - 295 7 037 1 643<br />
Business services - 157 21 - -<br />
Health and social services 152 5 282 -<br />
<strong>World</strong> <strong>Investment</strong> <strong>Report</strong> <strong>2010</strong>: Investing in a Low-Carbon Economy<br />
Table B. FDI inflows and outflows, and cross-border<br />
M&As sales and purchases, 2008–2009<br />
(Billions <strong>of</strong> dollars)<br />
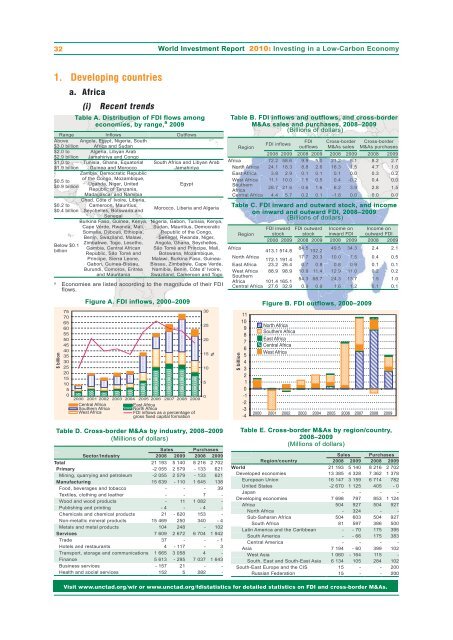
Figure A. FDI inflows, 2000–2009 Figure B. FDI outflows, 2000–2009<br />
2000 2001 2002 2003 2004 2005 2006 2007 2008 2009 0<br />
Central Africa<br />
Southern Africa<br />
West Africa<br />
East Africa<br />
North Africa<br />
FDI inflows as apercentage <strong>of</strong><br />
gross fixed capital formation<br />
30<br />
25<br />
20<br />
15<br />
10<br />
5<br />
%<br />
Table E. Cross-border M&As by region/country,<br />
2008–2009<br />
(Millions <strong>of</strong> dollars)<br />
Sales Purchases<br />
Region/country 2008 2009 2008 2009<br />
<strong>World</strong> 21 193 5 140 8 216 2 702<br />
Developed economies 13 385 4 328 7 362 1 378<br />
European Union 16 147 3 159 6 714 782<br />
United States -2 670 1 125 405 - 0<br />
Japan - - - -<br />
Developing economies 7 698 797 853 1 124<br />
Africa 504 927 504 927<br />
North Africa - 324 - -<br />
Sub-Saharan Africa 504 603 504 927<br />
South Africa 81 597 386 500<br />
Latin America and the Caribbean - - 70 175 395<br />
South America - - 66 175 383<br />
Central America - - - -<br />
Asia 7 194 - 60 399 102<br />
West Asia 1 060 - 164 115 -<br />
South, East and South-East Asia 6 134 105 284 102<br />
South-East Europe and the CIS 15 - - 200<br />
Russian Federation 15 - - 200<br />
Visit www.unctad.org/wir or www.unctad.org/fdistatistics for detailed statistics on FDI and cross-border M&As.<br />
Region<br />
FDI inflows<br />
FDI<br />
outflows<br />
Cross-border<br />
M&As sales<br />
Cross-border<br />
M&As purchases<br />
2008 2009 2008 2009 2008 2009 2008 2009<br />
Africa 72.2 58.6 9.9 5.0 21.2 5.1 8.2 2.7<br />
North Africa 24.1 18.3 8.8 2.6 16.3 1.5 4.7 1.0<br />
East Africa 3.8 2.9 0.1 0.1 0.1 0.0 0.3 0.2<br />
West Africa 11.1 10.0 1.5 0.5 0.4 -0.2 0.4 0.0<br />
Southern<br />
Africa<br />
28.7 21.6 - 0.6 1.6 6.2 3.9 2.8 1.5<br />
Central Africa 4.4 5.7 0.2 0.1 -1.8 0.0 0.0 0.0<br />
Table C. FDI inward and outward stock, and income<br />
on inward and outward FDI, 2008–2009<br />
(Billions <strong>of</strong> dollars)<br />
Region<br />
FDI inward FDI outward Income on Income on<br />
stock stock inward FDI outward FDI<br />
2008 2009 2008 2009 2008 2009 2008 2009<br />
Africa<br />
413.1 514.8 84.5<br />
102.2<br />
49.5 34.3 2.4 2.1<br />
North Africa<br />
17.7 20.3<br />
172.1 191.4<br />
10.0 7.5 0.4 0.5<br />
East Africa 23.2 26.4 0.7 0.8 0.8 0.9 0.1 0.1<br />
West Africa 88.9 98.9 10.9 11.4 12.9 11.0 0.2 0.2<br />
Southern<br />
Africa<br />
54.3 68.7<br />
101.4 165.1<br />
24.3 13.7 1.5 1.0<br />
Central Africa 27.6 32.9 0.9 0.9 1.6 1.2 0.1 0.1<br />
$ billion<br />
11<br />
10<br />
9<br />
8<br />
7<br />
6<br />
5<br />
4<br />
3<br />
2<br />
1<br />
0<br />
-1<br />
-2<br />
-3<br />
-4<br />
North Africa<br />
Southern Africa<br />
East Africa<br />
Central Africa<br />
West Africa<br />
2000 2001 2002 2003 2004 2005 2006 2007 2008 2009


