

UN World Investment Report 2010 - Office of Trade Negotiations
UN World Investment Report 2010 - Office of Trade Negotiations
UN World Investment Report 2010 - Office of Trade Negotiations

You also want an ePaper? Increase the reach of your titles
YUMPU automatically turns print PDFs into web optimized ePapers that Google loves.
2<br />
<strong>World</strong> <strong>Investment</strong> <strong>Report</strong> <strong>2010</strong>: Investing in a Low-Carbon Economy<br />
A. Global trends in FDI flows: from a steep<br />
decline to a slow recovery<br />
1. Overall and geographical trends<br />
Global FDI flows began to bottom out in the<br />
latter half <strong>of</strong> 2009. This was followed by a<br />
modest recovery in the first half <strong>of</strong> <strong>2010</strong>,<br />
sparking some cautious optimism for FDI<br />
prospects in the short term. In the longer<br />
term, from 2011 to 2012, the recovery in<br />
FDI flows is set to gather momentum. Global<br />
inflows are expected to pick up to over $1.2<br />
trillion in <strong>2010</strong>, rise further to $1.3–1.5<br />
trillion in 2011, and head towards $1.6–2<br />
trillion in 2012. These FDI prospects are,<br />
however, fraught with risks and uncertainties<br />
arising from the fragility <strong>of</strong> the global<br />
economic recovery.<br />
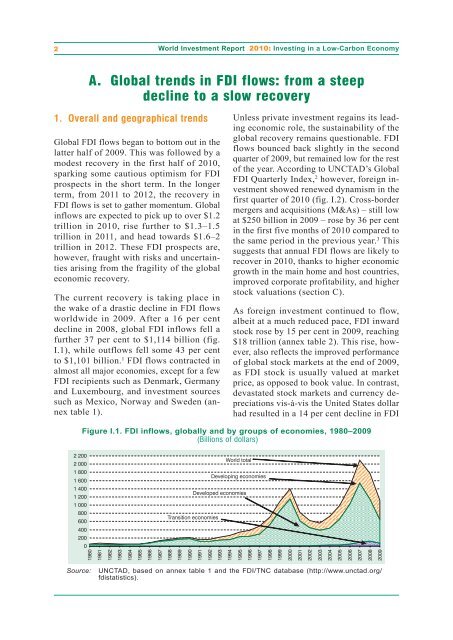
The current recovery is taking place in<br />
the wake <strong>of</strong> a drastic decline in FDI flows<br />
worldwide in 2009. After a 16 per cent<br />
decline in 2008, global FDI inflows fell a<br />
further 37 per cent to $1,114 billion (fig.<br />
I.1), while outflows fell some 43 per cent<br />
to $1,101 billion. 1 FDI flows contracted in<br />
almost all major economies, except for a few<br />
FDI recipients such as Denmark, Germany<br />
and Luxembourg, and investment sources<br />
such as Mexico, Norway and Sweden (annex<br />
table 1).<br />
2 200<br />
2 000<br />
1 800<br />
1 600<br />
1 400<br />
1 200<br />
1 000<br />
Unless private investment regains its leading<br />
economic role, the sustainability <strong>of</strong> the<br />
global recovery remains questionable. FDI<br />
flows bounced back slightly in the second<br />
quarter <strong>of</strong> 2009, but remained low for the rest<br />
<strong>of</strong> the year. According to <strong>UN</strong>CTAD’s Global<br />
FDI Quarterly Index, 2 however, foreign investment<br />
showed renewed dynamism in the<br />
first quarter <strong>of</strong> <strong>2010</strong> (fig. I.2). Cross-border<br />
mergers and acquisitions (M&As) – still low<br />
at $250 billion in 2009 – rose by 36 per cent<br />
in the first five months <strong>of</strong> <strong>2010</strong> compared to<br />
the same period in the previous year. 3 This<br />
suggests that annual FDI flows are likely to<br />
recover in <strong>2010</strong>, thanks to higher economic<br />
growth in the main home and host countries,<br />
improved corporate pr<strong>of</strong>itability, and higher<br />
stock valuations (section C).<br />
As foreign investment continued to flow,<br />
albeit at a much reduced pace, FDI inward<br />
stock rose by 15 per cent in 2009, reaching<br />
$18 trillion (annex table 2). This rise, however,<br />
also reflects the improved performance<br />
<strong>of</strong> global stock markets at the end <strong>of</strong> 2009,<br />
as FDI stock is usually valued at market<br />
price, as opposed to book value. In contrast,<br />
devastated stock markets and currency depreciations<br />
vis-à-vis the United States dollar<br />
had resulted in a 14 per cent decline in FDI<br />
Figure I.1. FDI inflows, globally and by groups <strong>of</strong> economies, 1980–2009<br />
(Billions <strong>of</strong> dollars)<br />
800<br />
600<br />
400<br />
200<br />
0<br />
1980<br />
1981<br />
1982<br />
1983<br />
1984<br />
1985<br />
1986<br />
1987<br />
1988<br />
1989<br />
1990<br />
1991<br />
1992<br />
1993<br />
<strong>World</strong> total<br />
Developing economies<br />
Developed economies<br />
Transition economies<br />
Source: <strong>UN</strong>CTAD, based on annex table 1 and the FDI/TNC database (http://www.unctad.org/<br />
fdistatistics).<br />
1994<br />
1995<br />
1996<br />
1997<br />
1998<br />
1999<br />
2000<br />
2001<br />
2002<br />
2003<br />
2004<br />
2005<br />
2006<br />
2007<br />
2008<br />
2009


