

UN World Investment Report 2010 - Office of Trade Negotiations
UN World Investment Report 2010 - Office of Trade Negotiations
UN World Investment Report 2010 - Office of Trade Negotiations

You also want an ePaper? Increase the reach of your titles
YUMPU automatically turns print PDFs into web optimized ePapers that Google loves.
48<br />
<strong>World</strong> <strong>Investment</strong> <strong>Report</strong> <strong>2010</strong>: Investing in a Low-Carbon Economy<br />
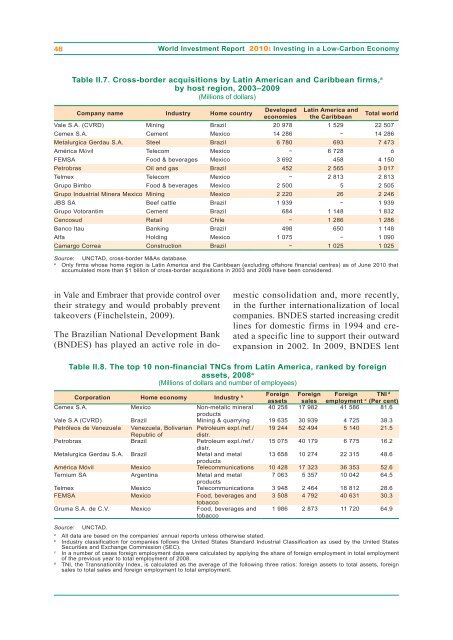
Table II.7. Cross-border acquisitions by Latin American and Caribbean firms, a<br />
by host region, 2003–2009<br />
(Millions <strong>of</strong> dollars)<br />
Company name Industry Home country<br />
in Vale and Embraer that provide control over<br />
their strategy and would probably prevent<br />
takeovers (Finchelstein, 2009).<br />
The Brazilian National Development Bank<br />
(BNDES) has played an active role in do-<br />
Table II.8. The top 10 non-financial TNCs from Latin America, ranked by foreign<br />
assets, 2008 a<br />
(Millions <strong>of</strong> dollars and number <strong>of</strong> employees)<br />
Corporation Home economy Industry b Foreign<br />
assets<br />
Foreign<br />
sales<br />
Foreign<br />
employment c<br />
TNI d<br />
(Per cent)<br />
Cemex S.A. Mexico Non-metalic mineral<br />
products<br />
40 258 17 982 41 586 81.6<br />
Vale S.A (CVRD) Brazil Mining & quarrying 19 635 30 939 4 725 38.3<br />
Petróleos de Venezuela Venezuela, Bolivarian Petroleum expl./ref./ 19 244 52 494 5 140 21.5<br />
Republic <strong>of</strong><br />
distr.<br />
Petrobras Brazil Petroleum expl./ref./<br />
distr.<br />
15 075 40 179 6 775 16.2<br />
Metalurgica Gerdau S.A. Brazil Metal and metal<br />
products<br />
13 658 10 274 22 315 48.6<br />
América Móvil Mexico Telecommunications 10 428 17 323 36 353 52.6<br />
Ternium SA Argentina Metal and metal<br />
products<br />
7 063 5 357 10 042 64.5<br />
Telmex Mexico Telecommunications 3 948 2 464 18 812 28.6<br />
FEMSA Mexico Food, beverages and<br />
tobacco<br />
3 508 4 792 40 631 30.3<br />
Gruma S.A. de C.V. Mexico Food, beverages and<br />
tobacco<br />
1 986 2 873 11 720 64.9<br />
Source: <strong>UN</strong>CTAD.<br />
Developed<br />
economies<br />
Latin America and<br />
the Caribbean<br />
Total world<br />
Vale S.A. (CVRD) Mining Brazil 20 978 1 529 22 507<br />
Cemex S.A. Cement Mexico 14 286 − 14 286<br />
Metalurgica Gerdau S.A. Steel Brazil 6 780 693 7 473<br />
América Móvil Telecom Mexico − 6 728 ó<br />
FEMSA Food & beverages Mexico 3 692 458 4 150<br />
Petrobras Oil and gas Brazil 452 2 565 3 017<br />
Telmex Telecom Mexico − 2 813 2 813<br />
Grupo Bimbo Food & beverages Mexico 2 500 5 2 505<br />
Grupo Industrial Minera Mexico Mining Mexico 2 220 26 2 246<br />
JBS SA Beef cattle Brazil 1 939 − 1 939<br />
Grupo Votorantim Cement Brazil 684 1 148 1 832<br />
Cencosud Retail Chile − 1 286 1 286<br />
Banco Itau Banking Brazil 498 650 1 148<br />
Alfa Holding Mexico 1 075 − 1 090<br />
Camargo Correa Construction Brazil − 1 025 1 025<br />
Source: <strong>UN</strong>CTAD, cross-border M&As database.<br />
a Only firms whose home region is Latin America and the Caribbean (excluding <strong>of</strong>fshore financial centres) as <strong>of</strong> June <strong>2010</strong> that<br />
accumulated more than $1 billion <strong>of</strong> cross-border acquisitions in 2003 and 2009 have been considered.<br />
mestic consolidation and, more recently,<br />
in the further internationalization <strong>of</strong> local<br />
companies. BNDES started increasing credit<br />
lines for domestic firms in 1994 and created<br />
a specific line to support their outward<br />
expansion in 2002. In 2009, BNDES lent<br />
a All data are based on the companies’ annual reports unless otherwise stated.<br />
b Industry classification for companies follows the United States Standard Industrial Classification as used by the United States<br />
Securities and Exchange Commission (SEC).<br />
c In a number <strong>of</strong> cases foreign employment data were calculated by applying the share <strong>of</strong> foreign employment in total employment<br />
<strong>of</strong> the previous year to total employment <strong>of</strong> 2008.<br />
d TNI, the Transnationlity Index, is calculated as the average <strong>of</strong> the following three ratios: foreign assets to total assets, foreign<br />
sales to total sales and foreign employment to total employment.


