

UN World Investment Report 2010 - Office of Trade Negotiations
UN World Investment Report 2010 - Office of Trade Negotiations
UN World Investment Report 2010 - Office of Trade Negotiations

Create successful ePaper yourself
Turn your PDF publications into a flip-book with our unique Google optimized e-Paper software.
176<br />
Memorandum<br />
Region/economy<br />
<strong>World</strong> <strong>Investment</strong> <strong>Report</strong> <strong>2010</strong>: Investing in a Low-Carbon Economy<br />
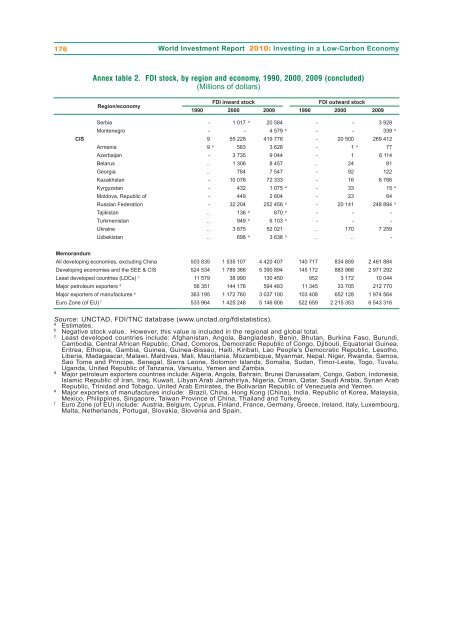
Annex table 2. FDI stock, by region and economy, 1990, 2000, 2009 (concluded)<br />
(Millions <strong>of</strong> dollars)<br />
FDI inward stock FDI outward stock<br />
1990 2000 2009 1990 2000 2009<br />
Serbia - 1 017 a 20 584 - - 3 928<br />
Montenegro - - 4 579 a - - 339 a<br />
CIS 9 55 228 419 776 - 20 500 269 412<br />
Armenia 9 a 583 3 628 - 1 a 77<br />
Azerbaijan - 3 735 9 044 - 1 6 114<br />
Belarus .. 1 306 8 457 .. 24 81<br />
Georgia .. 784 7 547 - 92 122<br />
Kazakhstan - 10 078 72 333 - 16 6 786<br />
Kyrgyzstan - 432 1 075 a - 33 15 a<br />
Moldova, Republic <strong>of</strong> - 449 2 604 - 23 64<br />
Russian Federation - 32 204 252 456 a - 20 141 248 894 a<br />
Tajikistan .. 136 a 870 a - - -<br />
Turkmenistan .. 949 a 6 103 a - - -<br />
Ukraine .. 3 875 52 021 .. 170 7 259<br />
Uzbekistan .. 698 a 3 638 a .. .. -<br />
All developing economies, excluding China 503 835 1 535 107 4 420 407 140 717 834 859 2 461 884<br />
Developing economies and the SEE & CIS 524 534 1 789 366 5 390 894 145 172 883 968 2 971 292<br />
Least developed countries (LDCs) c 11 579 38 990 130 450 952 3 172 10 044<br />
Major petroleum exporters d 56 351 144 178 594 483 11 345 33 705 212 770<br />
Major exporters <strong>of</strong> manufactures e 363 195 1 172 760 3 037 100 103 408 652 128 1 974 564<br />
Euro Zone (<strong>of</strong> EU) f 533 964 1 425 248 5 146 806 522 659 2 215 353 6 543 316<br />
Source: <strong>UN</strong>CTAD, FDI/TNC database (www.unctad.org/fdistatistics).<br />
a Estimates.<br />
b Negative stock value. However, this value is included in the regional and global total.<br />
c Least developed countries include: Afghanistan, Angola, Bangladesh, Benin, Bhutan, Burkina Faso, Burundi,<br />
Cambodia, Central African Republic, Chad, Comoros, Democratic Republic <strong>of</strong> Congo, Djibouti, Equatorial Guinea,<br />
Eritrea, Ethiopia, Gambia, Guinea, Guinea-Bissau, Haiti, Kiribati, Lao People's Democratic Republic, Lesotho,<br />
Liberia, Madagascar, Malawi, Maldives, Mali, Mauritania, Mozambique, Myanmar, Nepal, Niger, Rwanda, Samoa,<br />
Sao Tome and Principe, Senegal, Sierra Leone, Solomon Islands, Somalia, Sudan, Timor-Leste, Togo, Tuvalu,<br />
Uganda, United Republic <strong>of</strong> Tanzania, Vanuatu, Yemen and Zambia.<br />
d Major petroleum exporters countries include: Algeria, Angola, Bahrain, Brunei Darussalam, Congo, Gabon, Indonesia,<br />
Islamic Republic <strong>of</strong> Iran, Iraq, Kuwait, Libyan Arab Jamahiriya, Nigeria, Oman, Qatar, Saudi Arabia, Syrian Arab<br />
Republic, Trinidad and Tobago, United Arab Emirates, the Bolivarian Republic <strong>of</strong> Venezuela and Yemen.<br />
e Major exporters <strong>of</strong> manufactures include: Brazil, China, Hong Kong (China), India, Republic <strong>of</strong> Korea, Malaysia,<br />
Mexico, Philippines, Singapore, Taiwan Province <strong>of</strong> China, Thailand and Turkey.<br />
f Euro Zone (<strong>of</strong> EU) include: Austria, Belgium, Cyprus, Finland, France, Germany, Greece, Ireland, Italy, Luxembourg,<br />
Malta, Netherlands, Portugal, Slovakia, Slovenia and Spain.


