

UN World Investment Report 2010 - Office of Trade Negotiations
UN World Investment Report 2010 - Office of Trade Negotiations
UN World Investment Report 2010 - Office of Trade Negotiations

Create successful ePaper yourself
Turn your PDF publications into a flip-book with our unique Google optimized e-Paper software.
34<br />
the <strong>UN</strong>CTAD’s <strong>World</strong> <strong>Investment</strong> Prospects<br />
Survey (WIPS) (<strong>UN</strong>CTAD, forthcoming a).<br />
The strong performance <strong>of</strong> emerging Asian<br />
economies that are important sources <strong>of</strong><br />
FDI in Africa will support a revival <strong>of</strong> FDI<br />
inflows to Africa, and sustained intraregional<br />
investment will help small and low-income<br />
African countries ease their dependence on<br />
flows from traditional economies (section<br />
ii).<br />
The outlook for FDI outflows is also improving.<br />
<strong>Investment</strong> from Africa, especially<br />
within Africa, is expected to rebound in <strong>2010</strong>,<br />
sustained by recovering commodity prices<br />
and improving economic conditions in the<br />
region’s main investing countries, such as<br />
South Africa and Egypt.<br />
(ii) New sources <strong>of</strong> investment in<br />
Africa<br />
TNCs from developing The expansion <strong>of</strong> FDI<br />
economies are making a from developing econ-<br />
rapid entry into Africa. omies continues to be<br />
They are providing an important factor in<br />
additional development Africa’s investment<br />
opportunities and landscape in recent<br />
access to global years. The share <strong>of</strong><br />
markets.<br />
those emerging investors<br />
in FDI inflows to Africa increased from<br />
an average <strong>of</strong> 18 per cent in 1995–1999 to<br />
21 per cent for the period 2000–2008 (table<br />
II.2). The global financial crisis has reinforced<br />
this pattern, as investments from<br />
new sources proved more resilient than<br />
FDI from developed countries.<br />
Emerging TNCs from various regions.<br />
Although developed-country TNCs still<br />
account for the lion’s share <strong>of</strong> inward FDI<br />
stock and flows to many African countries,<br />
the presence <strong>of</strong> firms from developing<br />
countries – in particular, developing countries<br />
from Asia 3 – has been increasingly<br />
significant (table II.2; <strong>UN</strong>CTAD, <strong>2010</strong>a).<br />
Behind this increase are some important<br />
factors such as high commodity prices, the<br />
growing internationalization <strong>of</strong> emerging<br />
<strong>World</strong> <strong>Investment</strong> <strong>Report</strong> <strong>2010</strong>: Investing in a Low-Carbon Economy<br />
TNCs and fast-growing emerging economies<br />
in need <strong>of</strong> natural resources.<br />
FDI flows from developing Asia to Africa<br />
now account for a major part <strong>of</strong> interregional<br />
FDI flows among developing countries.<br />
China, in particular, has become one <strong>of</strong> the<br />
most significant foreign investors in some<br />
sub-Saharan African countries, while India<br />
and Malaysia are also substantial sources<br />
<strong>of</strong> FDI to the region (fig. II.1).<br />
When measured in value, most <strong>of</strong> the investments<br />
in the region from developing<br />
countries are resource-seeking, and <strong>of</strong>ten<br />
involve state-owned enterprises such as<br />
CNOOC (China), Petronas (Malaysia) and<br />
ONGC (India) (table II.3). The largest<br />
number <strong>of</strong> investment projects undertaken<br />
by Chinese and Indian investors, however,<br />
are in manufacturing and infrastructure (Gu,<br />
2009); 80 per cent <strong>of</strong> Indian investments in<br />
eight East African countries, for example, are<br />
market-seeking. While labour costs in Africa<br />
may not differ significantly from those in<br />
the firms’ home economies, the duty-free,<br />
quota-free access <strong>of</strong> African countries to<br />
developed countries through the African<br />
Growth and Opportunity Act (AGOA) and<br />
the European Union’s (EU’s) Everything<br />
But Arms (EBA) initiative have generated<br />
some efficiency-seeking investment. This<br />
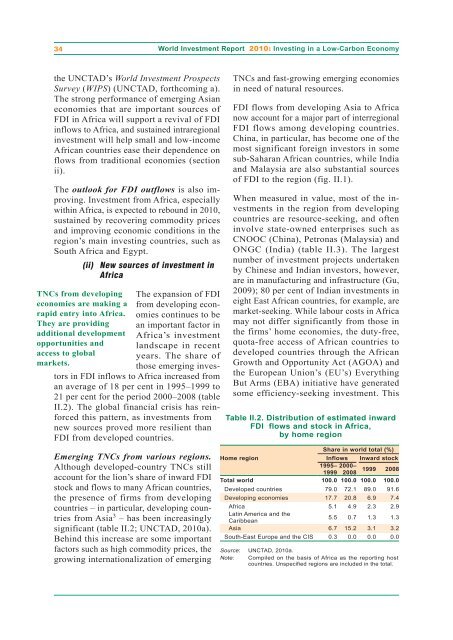
Table II.2. Distribution <strong>of</strong> estimated inward<br />
FDI flows and stock in Africa,<br />
by home region<br />
Share in world total (%)<br />
Home region Inflows Inward stock<br />
1995– 2000–<br />
1999 2008<br />
1999 2008<br />
Total world 100.0 100.0 100.0 100.0<br />
Developed countries 79.0 72.1 89.0 91.6<br />
Developing economies 17.7 20.8 6.9 7.4<br />
Africa 5.1 4.9 2.3 2.9<br />
Latin America and the<br />
Caribbean<br />
5.5 0.7 1.3 1.3<br />
Asia 6.7 15.2 3.1 3.2<br />
South-East Europe and the CIS 0.3 0.0 0.0 0.0<br />
Source: <strong>UN</strong>CTAD, <strong>2010</strong>a.<br />
Note: Compiled on the basis <strong>of</strong> Africa as the reporting host<br />
countries. Unspecified regions are included in the total.


