

UN World Investment Report 2010 - Office of Trade Negotiations
UN World Investment Report 2010 - Office of Trade Negotiations
UN World Investment Report 2010 - Office of Trade Negotiations

You also want an ePaper? Increase the reach of your titles
YUMPU automatically turns print PDFs into web optimized ePapers that Google loves.
10<br />
4. FDI by sector and industry<br />
Services and the<br />
primary sector<br />
continue to capture<br />
an increasing share<br />
<strong>of</strong> FDI. The decline in<br />
FDI affected not only<br />
industries sensitive to<br />
economic cycles, but<br />
also industries that<br />
were initially resilient<br />
to the crisis.<br />
FDI inflows and outflows<br />
slumped in all<br />
three sectors (primary,<br />
manufacturing and services)<br />
in 2009. 10 The<br />
global economic and financial<br />
crisis continued<br />
to dampen FDI flows<br />
not only in industries<br />
sensitive to business<br />
cycles – such as chemicals<br />
and the automobile<br />
industry – but also in those that were relatively<br />
resilient in 2008, such as pharmaceuticals<br />
and food and beverage products. In 2009,<br />
only a handful <strong>of</strong> industries generated higher<br />
investments via cross-border M&As than in<br />
the previous year; these included electrical<br />
and electronic equipment, electricity services<br />
and construction. Telecommunication services<br />
also continued to expand, protected by<br />
resilient demand and a slightly lower internationalization<br />
than in other<br />
industries (e.g. in the United<br />
States, FDI in the information<br />
industry, which includes<br />
telecommunications, rose by<br />
41 per cent in 2009 compared<br />
to 2008 (United States, Bureau<br />
<strong>of</strong> Economic Analysis,<br />
<strong>2010</strong>)).<br />
In 2009, the value <strong>of</strong> crossborder<br />
M&As in the primary<br />
sector declined by 47<br />
per cent after the peak <strong>of</strong><br />
2008. Energy investment<br />
worldwide plunged, in the<br />
face <strong>of</strong> a tougher financing<br />
environment, weakening<br />
final demand and low<br />
cash flows. The economic<br />
recession caused the global<br />
use <strong>of</strong> energy to fall in 2009<br />
for the first time since 1981,<br />
although it is expected to<br />
resume its long-term upward<br />
<strong>World</strong> <strong>Investment</strong> <strong>Report</strong> <strong>2010</strong>: Investing in a Low-Carbon Economy<br />
trend shortly (International Energy Agency<br />
(IEA), 2009). In the oil and gas industries,<br />
most companies cut back capital spending not<br />
only by drilling fewer wells but also by delaying<br />
and even cancelling exploration projects.<br />
The Gulf <strong>of</strong> Mexico oil spill in mid-<strong>2010</strong>, the<br />
largest <strong>of</strong> its kind in United States history,<br />
may threaten the recovery <strong>of</strong> the industry<br />
as countries reassess the use <strong>of</strong> their coastal<br />
resources – host to many recent oil discoveries.<br />
Nevertheless, mining activities remained<br />
relatively high (table I.2) and are expected<br />
to recover quickly. 11 FDI in agriculture also<br />
declined in absolute terms in 2009, based<br />
on the value <strong>of</strong> cross-border M&As in the<br />
sector; the number <strong>of</strong> transactions, however,<br />
increased (from 59 to 63 (table I.2)).<br />
The global slowdown and tumbling consumer<br />
confidence took a toll on many manufacturing<br />
industries. The value <strong>of</strong> cross-border<br />
M&As in this sector collapsed by 77 per<br />
cent in 2009. Worst hit were manufacturing<br />
goods such as non-metallic mineral products,<br />
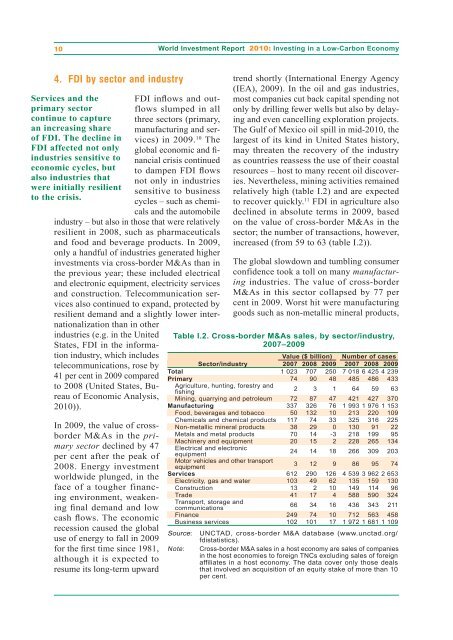
Table I.2. Cross-border M&As sales, by sector/industry,<br />
2007–2009<br />
Value ($ billion) Number <strong>of</strong> cases<br />
Sector/industry 2007 2008 2009 2007 2008 2009<br />
Total 1 023 707 250 7 018 6 425 4 239<br />
Primary 74 90 48 485 486 433<br />
Agriculture, hunting, forestry and<br />
2 3 1 64 59 63<br />
fishing<br />
Mining, quarrying and petroleum 72 87 47 421 427 370<br />
Manufacturing 337 326 76 1 993 1 976 1 153<br />
Food, beverages and tobacco 50 132 10 213 220 109<br />
Chemicals and chemical products 117 74 33 325 316 225<br />
Non-metallic mineral products 38 29 0 130 91 22<br />
Metals and metal products 70 14 -3 218 199 95<br />
Machinery and equipment 20 15 2 228 265 134<br />
Electrical and electronic<br />
equipment<br />
24 14 18 266 309 203<br />
Motor vehicles and other transport<br />
3 12 9 86 95 74<br />
equipment<br />
Services 612 290 126 4 539 3 962 2 653<br />
Electricity, gas and water 103 49 62 135 159 130<br />
Construction 13 2 10 149 114 96<br />
<strong>Trade</strong> 41 17 4 588 590 324<br />
Transport, storage and<br />
66 34 16 436 343 211<br />
communications<br />
Finance 249 74 10 712 563 458<br />
Business services 102 101 17 1 972 1 681 1 109<br />
Source: <strong>UN</strong>CTAD, cross-border M&A database (www.unctad.org/<br />
fdistatistics).<br />
Note: Cross-border M&A sales in a host economy are sales <strong>of</strong> companies<br />
in the host economies to foreign TNCs excluding sales <strong>of</strong> foreign<br />
affiliates in a host economy. The data cover only those deals<br />
that involved an acquisition <strong>of</strong> an equity stake <strong>of</strong> more than 10<br />
per cent.


