ANNUAL REPORT 2011 REGISTRATION DOCUMENT - Saft
ANNUAL REPORT 2011 REGISTRATION DOCUMENT - Saft
ANNUAL REPORT 2011 REGISTRATION DOCUMENT - Saft

Create successful ePaper yourself
Turn your PDF publications into a flip-book with our unique Google optimized e-Paper software.
5 Earnings<br />
COMMENTS ON THE <strong>2011</strong> FINANCIAL YEAR<br />
by division<br />
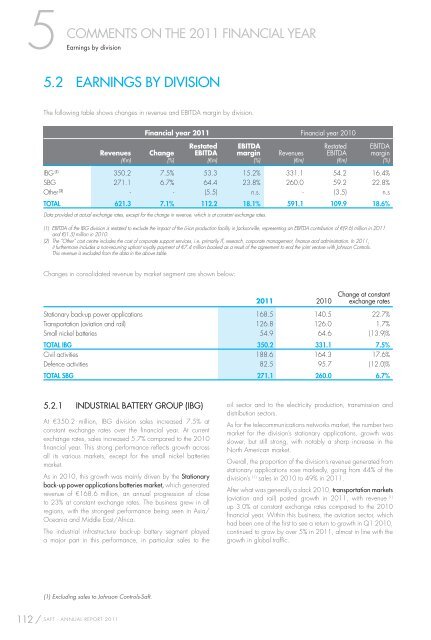
5.2 EARNINGS BY DIVISION<br />
The following table shows changes in revenue and EBITDA margin by division.<br />
Revenues<br />
(€m)<br />
112 / SAFT - <strong>ANNUAL</strong> <strong>REPORT</strong> <strong>2011</strong><br />
Financial year <strong>2011</strong> Financial year 2010<br />
Change<br />
(%)<br />
Restated<br />
EBITDA<br />
(€m)<br />
EBITDA<br />
margin<br />
(%)<br />
Revenues<br />
(€m)<br />
Restated<br />
EBITDA<br />
(€m)<br />
EBITDA<br />
margin<br />
(%)<br />
IBG (1) 350.2 7.5% 53.3 15.2% 331.1 54.2 16.4%<br />
SBG 271.1 6.7% 64.4 23.8% 260.0 59.2 22.8%<br />
Other (2) - - (5.5) n.s. - (3.5) n.s<br />
TOTAL 621.3 7.1% 112.2 18.1% 591.1 109.9 18.6%<br />
Data provided at actual exchange rates, except for the change in revenue, which is at constant exchange rates.<br />
(1) EBITDA of the IBG division is restated to exclude the impact of the Li-ion production facility in Jacksonville, representing an EBITDA contribution of €(9.6) million in <strong>2011</strong><br />
and €(1.5) million in 2010.<br />
(2) The “Other” cost centre includes the cost of corporate support services, i.e. primarily IT, research, corporate management, fi nance and administration. In <strong>2011</strong>,<br />
it furthermore includes a non-recurring upfront royalty payment of €7.4 million booked as a result of the agreement to end the joint venture with Johnson Controls.<br />
This revenue is excluded from the data in the above table.<br />
Changes in consolidated revenue by market segment are shown below:<br />
<strong>2011</strong> 2010<br />
Change at constant<br />
exchange rates<br />
Stationary back-up power applications 168.5 140.5 22.7%<br />
Transportation (aviation and rail) 126.8 126.0 1.7%<br />
Small nickel batteries 54.9 64.6 (13.9)%<br />
TOTAL IBG 350.2 331.1 7.5%<br />
Civil activities 188.6 164.3 17.6%<br />
Defence activities 82.5 95.7 (12.0)%<br />
TOTAL SBG 271.1 260.0 6.7%<br />
5.2.1 INDUSTRIAL BATTERY GROUP (IBG)<br />
At €350.2 million, IBG division sales increased 7.5% at<br />
constant exchange rates over the fi nancial year. At current<br />
exchange rates, sales increased 5.7% compared to the 2010<br />
fi nancial year. This strong performance refl ects growth across<br />
all its various markets, except for the small nickel batteries<br />
market.<br />
As in 2010, this growth was mainly driven by the Stationary<br />
back-up power applications batteries market, which generated<br />
revenue of €168.6 million, an annual progression of close<br />
to 23% at constant exchange rates. The business grew in all<br />
regions, with the strongest performance being seen in Asia/<br />
Oceania and Middle East/Africa.<br />
The industrial infrastructure back-up battery segment played<br />
a major part in this performance, in particular sales to the<br />
(1) Excluding sales to Johnson Controls-<strong>Saft</strong>.<br />
oil sector and to the electricity production, transmission and<br />
distribution sectors.<br />
As for the telecommunications networks market, the number two<br />
market for the division’s stationary applications, growth was<br />
slower, but still strong, with notably a sharp increase in the<br />
North American market.<br />
Overall, the proportion of the division’s revenue generated from<br />
stationary applications rose markedly, going from 44% of the<br />
division’s (1) sales in 2010 to 49% in <strong>2011</strong>.<br />
After what was generally a slack 2010, transportation markets<br />
(aviation and rail) posted growth in <strong>2011</strong>, with revenue (1)<br />
up 3.0% at constant exchange rates compared to the 2010<br />
fi nancial year. Within this business, the aviation sector, which<br />
had been one of the fi rst to see a return to growth in Q1 2010,<br />
continued to grow by over 5% in <strong>2011</strong>, almost in line with the<br />
growth in global traffi c.