ANNUAL REPORT 2011 REGISTRATION DOCUMENT - Saft
ANNUAL REPORT 2011 REGISTRATION DOCUMENT - Saft
ANNUAL REPORT 2011 REGISTRATION DOCUMENT - Saft

Create successful ePaper yourself
Turn your PDF publications into a flip-book with our unique Google optimized e-Paper software.
6 Notes<br />
<strong>2011</strong> CONSOLIDATED FINANCIAL STATEMENTS<br />
to the Consolidated Financial Statements<br />
NOTE 29 RELATED-PARTY TRANSACTIONS AND INVESTMENTS<br />
IN ASSOCIATES<br />
Following the sale by the Group of its 49% stake in the<br />
joint venture Johnson Controls-<strong>Saft</strong> on 30 September <strong>2011</strong>,<br />
investments in associates are limited to a 50% interest in ASB,<br />
the joint venture with EADS.<br />
Transactions regarding Johnson Controls-<strong>Saft</strong> and its sale<br />
are detailed in Note 30 “Net profi t/(loss) from discontinued<br />
operations” of the Consolidated Financial Statements.<br />
29.1 INVESTMENTS IN ASSOCIATES<br />
The <strong>Saft</strong> Group holds a 50% interest in the share capital of<br />
ASB and its subsidiaries, jointly with the EADS Group. ASB<br />
manufacture and sell thermal batteries for military applications.<br />
176 / SAFT - <strong>ANNUAL</strong> <strong>REPORT</strong> <strong>2011</strong><br />
As mentioned in Note 2.4 relative of the consolidation<br />
methods, ASB is consolidated under the equity method, being<br />
a jointly controlled venture.<br />
29.2 RELATED-PARTY TRANSACTIONS<br />
The Group does not realise any sales with ASB, a company in<br />
which it holds a 50% interest and which is consolidated under<br />
the equity method. Support services provided and invoiced by<br />
the <strong>Saft</strong> Group to the ASB Group amounted to €0.3 million in<br />
<strong>2011</strong> as compared to €0.3 million both in 2010 and 2009.<br />
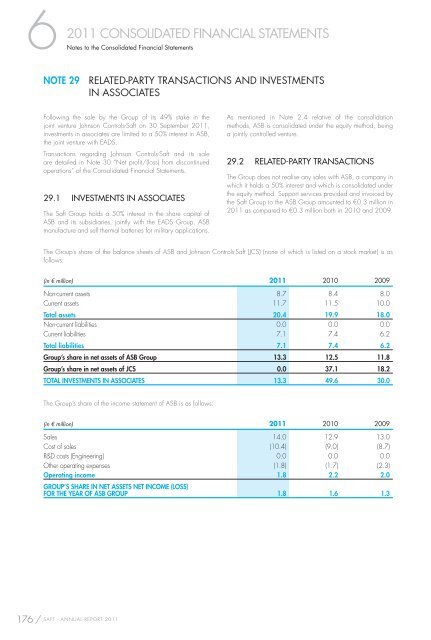
The Group’s share of the balance sheets of ASB and Johnson Controls-<strong>Saft</strong> (JCS) (none of which is listed on a stock market) is as<br />
follows:<br />
(in € million) <strong>2011</strong> 2010 2009<br />
Non-current assets 8.7 8.4 8.0<br />
Current assets 11.7 11.5 10.0<br />
Total assets 20.4 19.9 18.0<br />
Non-current liabilities 0.0 0.0 0.0<br />
Current liabilities 7.1 7.4 6.2<br />
Total liabilities 7.1 7.4 6.2<br />
Group’s share in net assets of ASB Group 13.3 12.5 11.8<br />
Group’s share in net assets of JCS 0.0 37.1 18.2<br />
TOTAL INVESTMENTS IN ASSOCIATES 13.3 49.6 30.0<br />
The Group’s share of the income statement of ASB is as follows:<br />
(in € million) <strong>2011</strong> 2010 2009<br />
Sales 14.0 12.9 13.0<br />
Cost of sales (10.4) (9.0) (8.7)<br />
R&D costs (Engineering) 0.0 0.0 0.0<br />
Other operating expenses (1.8) (1.7) (2.3)<br />
Operating income 1.8 2.2 2.0<br />
GROUP’S SHARE IN NET ASSETS NET INCOME (LOSS)<br />
FOR THE YEAR OF ASB GROUP 1.8 1.6 1.3