ANNUAL REPORT 2011 REGISTRATION DOCUMENT - Saft
ANNUAL REPORT 2011 REGISTRATION DOCUMENT - Saft
ANNUAL REPORT 2011 REGISTRATION DOCUMENT - Saft

You also want an ePaper? Increase the reach of your titles
YUMPU automatically turns print PDFs into web optimized ePapers that Google loves.
6<br />
<strong>2011</strong> CONSOLIDATED FINANCIAL STATEMENTS<br />
Notes to the Consolidated Financial Statements<br />
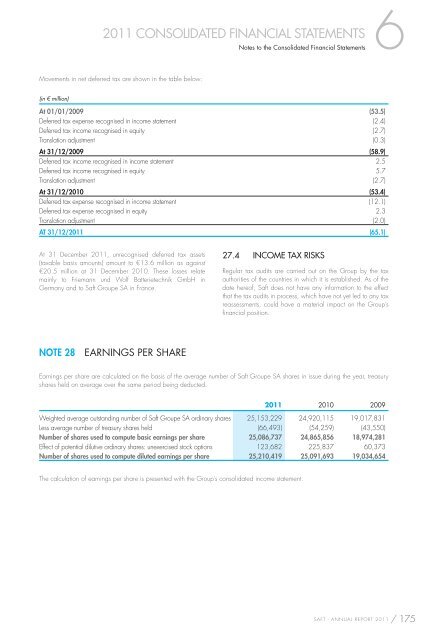
Movements in net deferred tax are shown in the table below:<br />
(in € million)<br />
At 01/01/2009 (53.5)<br />
Deferred tax expense recognised in income statement (2.4)<br />
Deferred tax income recognised in equity (2.7)<br />
Translation adjustment (0.3)<br />
At 31/12/2009 (58.9)<br />
Deferred tax income recognised in income statement 2.5<br />
Deferred tax income recognised in equity 5.7<br />
Translation adjustment (2.7)<br />
At 31/12/2010 (53.4)<br />
Deferred tax expense recognised in income statement (12.1)<br />
Deferred tax expense recognised in equity 2.3<br />
Translation adjustment (2.0)<br />
AT 31/12/<strong>2011</strong> (65.1)<br />
At 31 December <strong>2011</strong>, unrecognised deferred tax assets<br />
(taxable basis amounts) amount to €13.6 million as against<br />
€20.5 million at 31 December 2010. These losses relate<br />
mainly to Friemann und Wolf Batterietechnik GmbH in<br />
Germany and to <strong>Saft</strong> Groupe SA in France.<br />
NOTE 28 EARNINGS PER SHARE<br />
27.4 INCOME TAX RISKS<br />
Regular tax audits are carried out on the Group by the tax<br />
authorities of the countries in which it is established. As of the<br />
date hereof, <strong>Saft</strong> does not have any information to the effect<br />
that the tax audits in process, which have not yet led to any tax<br />
reassessments, could have a material impact on the Group’s<br />
fi nancial position.<br />
Earnings per share are calculated on the basis of the average number of <strong>Saft</strong> Groupe SA shares in issue during the year, treasury<br />
shares held on average over the same period being deducted.<br />
<strong>2011</strong> 2010 2009<br />
Weighted average outstanding number of <strong>Saft</strong> Groupe SA ordinary shares 25,153,229 24,920,115 19,017,831<br />
Less average number of treasury shares held (66,493) (54,259) (43,550)<br />
Number of shares used to compute basic earnings per share 25,086,737 24,865,856 18,974,281<br />
Effect of potential dilutive ordinary shares: unexercised stock options 123,682 225,837 60,373<br />
Number of shares used to compute diluted earnings per share 25,210,419 25,091,693 19,034,654<br />
The calculation of earnings per share is presented with the Group’s consolidated income statement.<br />
SAFT - <strong>ANNUAL</strong> <strong>REPORT</strong> <strong>2011</strong> / 175