ANNUAL REPORT 2011 REGISTRATION DOCUMENT - Saft
ANNUAL REPORT 2011 REGISTRATION DOCUMENT - Saft
ANNUAL REPORT 2011 REGISTRATION DOCUMENT - Saft

Create successful ePaper yourself
Turn your PDF publications into a flip-book with our unique Google optimized e-Paper software.
6<br />
<strong>2011</strong> CONSOLIDATED FINANCIAL STATEMENTS<br />
Notes to the Consolidated Financial Statements<br />
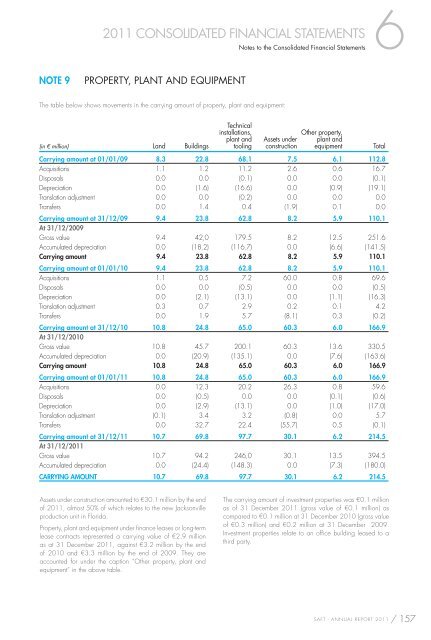
NOTE 9 PROPERTY, PLANT AND EQUIPMENT<br />
The table below shows movements in the carrying amount of property, plant and equipment:<br />
(in € million) Land Buildings<br />
Technical<br />
installations,<br />
plant and<br />
tooling<br />
Assets under<br />
construction<br />
Other property,<br />
plant and<br />
equipment Total<br />
Carrying amount at 01/01/09 8.3 22.8 68.1 7.5 6.1 112.8<br />
Acquisitions 1.1 1.2 11.2 2.6 0.6 16.7<br />
Disposals 0.0 0.0 (0.1) 0.0 0.0 (0.1)<br />
Depreciation 0.0 (1.6) (16.6) 0.0 (0.9) (19.1)<br />
Translation adjustment 0.0 0.0 (0.2) 0.0 0.0 0.0<br />
Transfers 0.0 1.4 0.4 (1.9) 0.1 0.0<br />
Carrying amount at 31/12/09<br />
At 31/12/2009<br />
9.4 23.8 62.8 8.2 5.9 110.1<br />
Gross value 9.4 42,0 179.5 8.2 12.5 251.6<br />
Accumulated depreciation 0.0 (18.2) (116.7) 0.0 (6.6) (141.5)<br />
Carrying amount 9.4 23.8 62.8 8.2 5.9 110.1<br />
Carrying amount at 01/01/10 9.4 23.8 62.8 8.2 5.9 110.1<br />
Acquisitions 1.1 0.5 7.2 60.0 0.8 69.6<br />
Disposals 0.0 0.0 (0.5) 0.0 0.0 (0.5)<br />
Depreciation 0.0 (2.1) (13.1) 0.0 (1.1) (16.3)<br />
Translation adjustment 0.3 0.7 2.9 0.2 0.1 4.2<br />
Transfers 0.0 1.9 5.7 (8.1) 0.3 (0.2)<br />
Carrying amount at 31/12/10<br />
At 31/12/2010<br />
10.8 24.8 65.0 60.3 6.0 166.9<br />
Gross value 10.8 45.7 200.1 60.3 13.6 330.5<br />
Accumulated depreciation 0.0 (20.9) (135.1) 0.0 (7.6) (163.6)<br />
Carrying amount 10.8 24.8 65.0 60.3 6.0 166.9<br />
Carrying amount at 01/01/11 10.8 24.8 65.0 60.3 6.0 166.9<br />
Acquisitions 0.0 12.3 20.2 26.3 0.8 59.6<br />
Disposals 0.0 (0.5) 0.0 0.0 (0.1) (0.6)<br />
Depreciation 0.0 (2.9) (13.1) 0.0 (1.0) (17.0)<br />
Translation adjustment (0.1) 3.4 3.2 (0.8) 0.0 5.7<br />
Transfers 0.0 32.7 22.4 (55.7) 0.5 (0.1)<br />
Carrying amount at 31/12/11<br />
At 31/12/<strong>2011</strong><br />
10.7 69.8 97.7 30.1 6.2 214.5<br />
Gross value 10.7 94.2 246,0 30.1 13.5 394.5<br />
Accumulated depreciation 0.0 (24.4) (148.3) 0.0 (7.3) (180.0)<br />
CARRYING AMOUNT 10.7 69.8 97.7 30.1 6.2 214.5<br />
Assets under construction amounted to €30.1 million by the end<br />
of <strong>2011</strong>, almost 50% of which relates to the new Jacksonville<br />
production unit in Florida.<br />
Property, plant and equipment under fi nance leases or long-term<br />
lease contracts represented a carrying value of €2.9 million<br />
as at 31 December <strong>2011</strong>, against €3.2 million by the end<br />
of 2010 and €3.3 million by the end of 2009. They are<br />
accounted for under the caption “Other property, plant and<br />
equipment” in the above table.<br />
The carrying amount of investment properties was €0.1 million<br />
as of 31 December <strong>2011</strong> (gross value of €0.1 million) as<br />
compared to €0.1 million at 31 December 2010 (gross value<br />
of €0.3 million) and €0.2 million at 31 December 2009.<br />
Investment properties relate to an offi ce building leased to a<br />
third party.<br />
SAFT - <strong>ANNUAL</strong> <strong>REPORT</strong> <strong>2011</strong> / 157