ANNUAL REPORT 2011 REGISTRATION DOCUMENT - Saft
ANNUAL REPORT 2011 REGISTRATION DOCUMENT - Saft
ANNUAL REPORT 2011 REGISTRATION DOCUMENT - Saft

Create successful ePaper yourself
Turn your PDF publications into a flip-book with our unique Google optimized e-Paper software.
Type and amount of waste generated by our plants<br />
All waste fl ows generated by our sites are duly identifi ed,<br />
weighed and then recorded in the waste register. Our waste<br />
fl ows are thus precisely monitored and recorded based on<br />
their characteristics (hazardous or non-hazardous) and fi nal<br />
destination (recovery or elimination).<br />
The quantities of waste generated may be reduced by<br />
improving control over manufacturing processes. However,<br />
since our products are constantly evolving and new products<br />
typically require novel manufacturing processes, we are often<br />
required to discard non-conforming products, treating them as<br />
waste.<br />
We constantly strive to identify new recovery solutions and<br />
better segregate waste fl ows in order to decrease the fraction<br />
of non-recovered waste.<br />
The results of the Group’s efforts can be seen in the table below.<br />
Since 2008, the amount of waste generated by the Group<br />
has decreased by 9%. On a like-for-like basis (i.e. excluding<br />
the new sites and assuming similar production volumes), we<br />
estimate that the amount of waste generated has decreased by<br />
approximately by 18% since 2008.<br />
3<br />
SUSTAINABLE DEVELOPMENT<br />
Environmental responsibility<br />
Furthermore, 34% of hazardous waste and 65% of nonhazardous<br />
waste undergoes recovery, thereby allowing the<br />
materials extracted to be reused for industrial purposes P (1) .<br />
Energy consumption<br />
All energy consumption is metered, whether it be electricity<br />
(from all sources), natural gas or steam. Energy consumption<br />
can be reduced by optimising the energy effi ciency of industrial<br />
processes and buildings (heating, lighting, air conditioning,<br />
etc.).<br />
The results of the Group’s efforts can be seen in the table<br />
below. Since 2008, energy consumption has stabilised, and<br />
since 2005, when consolidated tracking was implemented for<br />
this indicator, energy consumption has decreased by 8%.<br />
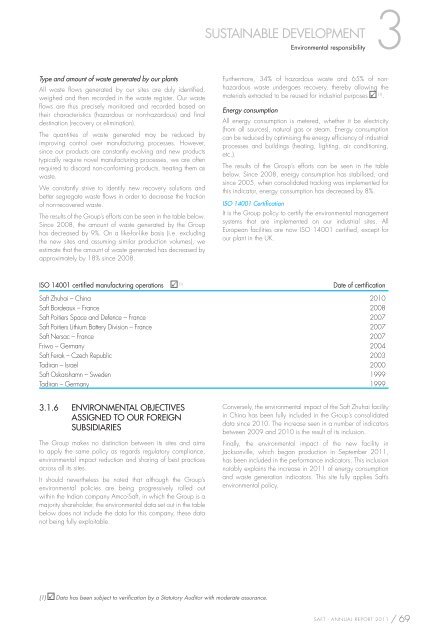
ISO 14001 Certifi cation<br />
(1) P Data has been subject to verifi cation by a Statutory Auditor with moderate assurance.<br />
It is the Group policy to certify the environmental management<br />
systems that are implemented on our industrial sites. All<br />
European facilities are now ISO 14001 certifi ed, except for<br />
our plant in the UK.<br />
ISO 14001 certifi ed manufacturing operations P (1) Date of certifi cation<br />
<strong>Saft</strong> Zhuhai – China 2010<br />
<strong>Saft</strong> Bordeaux – France 2008<br />
<strong>Saft</strong> Poitiers Space and Defence – France 2007<br />
<strong>Saft</strong> Poitiers Lithium Battery Division – France 2007<br />
<strong>Saft</strong> Nersac – France 2007<br />
Friwo – Germany 2004<br />
<strong>Saft</strong> Ferak – Czech Republic 2003<br />
Tadiran – Israel 2000<br />
<strong>Saft</strong> Oskarshamn – Sweden 1999<br />
Tadiran – Germany 1999<br />
3.1.6 ENVIRONMENTAL OBJECTIVES<br />
ASSIGNED TO OUR FOREIGN<br />
SUBSIDIARIES<br />
The Group makes no distinction between its sites and aims<br />
to apply the same policy as regards regulatory compliance,<br />
environmental impact reduction and sharing of best practices<br />
across all its sites.<br />
It should nevertheless be noted that although the Group’s<br />
environmental policies are being progressively rolled out<br />
within the Indian company Amco-<strong>Saft</strong>, in which the Group is a<br />
majority shareholder, the environmental data set out in the table<br />
below does not include the data for this company, these data<br />
not being fully exploitable.<br />
Conversely, the environmental impact of the <strong>Saft</strong> Zhuhai facility<br />
in China has been fully included in the Group’s consolidated<br />
data since 2010. The increase seen in a number of indicators<br />
between 2009 and 2010 is the result of its inclusion.<br />
Finally, the environmental impact of the new facility in<br />
Jacksonville, which began production in September <strong>2011</strong>,<br />
has been included in the performance indicators. This inclusion<br />
notably explains the increase in <strong>2011</strong> of energy consumption<br />
and waste generation indicators. This site fully applies <strong>Saft</strong>’s<br />
environmental policy.<br />
SAFT - <strong>ANNUAL</strong> <strong>REPORT</strong> <strong>2011</strong> / 69