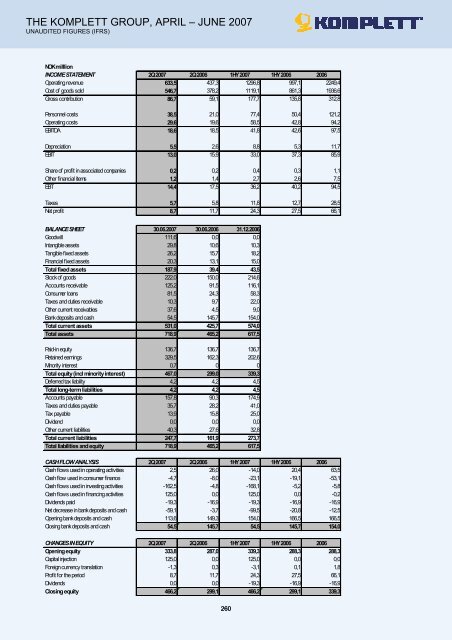
THE KOMPLETT GROUP, APRIL – JUNE 2007 UNAUDITED FIGURES (IFRS) NOK milllion INCOME STATEMENT 2Q 2007 2Q 2006 1HY 2007 1HY 2006 2006 Operating revenue 633,5 437,3 1296,8 997,1 2249,4 Cost of goods sold 546,7 378,2 1119,1 861,3 1936,6 Gross contribution 86,7 59,1 177,7 135,8 312,8 Personnel costs 38,5 21,0 77,4 50,4 121,2 Operating costs 29,6 19,6 58,5 42,8 94,2 EBITDA 18,6 18,5 41,8 42,6 97,5 Depreciation 5,5 2,6 8,8 5,3 11,7 EBIT 13,0 15,9 33,0 37,3 85,9 Share of profit in associated companies 0,2 0,2 0,4 0,3 1,1 Other financial items 1,2 1,4 2,7 2,6 7,5 EBT 14,4 17,5 36,2 40,2 94,5 Taxes 5,7 5,8 11,8 12,7 28,5 Net profit 8,7 11,7 24,3 27,5 66,1 BALANCE SHEET 30.06.2007 30.06.2006 31.12.2006 Goodwill 111,6 0,0 0,0 Intangible assets 29,8 10,6 10,3 Tangible fixed assets 26,2 15,7 18,2 Financial fixed assets 20,3 13,1 15,0 Total fixed assets 187,9 39,4 43,5 Stock of goods 222,0 150,0 214,6 Accounts receivable 125,2 91,5 116,1 Consumer loans 81,5 24,3 58,3 Taxes and duties receivable 10,3 9,7 22,0 Other current receivables 37,6 4,5 9,0 Bank deposits and cash 54,5 145,7 154,0 Total current assets 531,0 425,7 574,0 Total assets 718,9 465,2 617,5 Paid-in equity 136,7 136,7 136,7 Retained earnings 329,5 162,3 202,6 Minority interest 0,7 0 0 Total equity (incl minority interest) 467,0 299,0 339,3 Deferred tax liability 4,2 4,2 4,5 Total long-term liabilities 4,2 4,2 4,5 Accounts payable 157,8 90,3 174,9 Taxes and duties payable 35,7 28,2 41,0 Tax payable 13,9 15,8 25,0 Dividend 0,0 0,0 0,0 Other current liabilities 40,3 27,6 32,8 Total current liabilities 247,7 161,9 273,7 Total liabilities and equity 718,9 465,2 617,5 CASH FLOW ANALYSIS 2Q 2007 2Q 2006 1HY 2007 1HY 2006 2006 Cash flows used in operating activities 2,5 26,0 -14,0 20,4 63,5 Cash flow used in consumer finance -4,7 -8,0 -23,1 -19,1 -53,1 Cash flows used in investing activities -162,5 -4,8 -168,1 -5,2 -5,8 Cash flows used in financing activities 125,0 0,0 125,0 0,0 -0,2 Dividends paid -19,3 -16,9 -19,3 -16,9 -16,9 Net decrease in bank deposits and cash -59,1 -3,7 -99,5 -20,8 -12,5 Opening bank deposits and cash 113,6 149,3 154,0 166,5 166,5 Closing bank deposits and cash 54,5 145,7 54,5 145,7 154,0 CHANGES IN EQUITY 2Q 2007 2Q 2006 1HY 2007 1HY 2006 2006 Opening equity 333,8 287,0 339,3 288,3 288,3 Capital injection 125,0 0,0 125,0 0,0 0,0 Foreign currency translation -1,3 0,3 -3,1 0,1 1,8 Profit for the period 8,7 11,7 24,3 27,5 66,1 Dividends 0,0 0,0 -19,3 -16,9 -16,9 Closing equity 466,2 299,1 466,2 299,1 339,3 260
SEGMENT INFORMATION 2007 Scandinavia Western-Europe Consumer financing Operating revenue * 1Q 583,1 76,6 4,3 -0,7 663,3 2Q 568,6 60,0 5,3 -0,4 633,5 3Q 0,0 4Q 0,0 Totalt YTD 1 151,7 136,6 9,6 -1,1 1 296,8 EBIT 1Q 19,3 -0,5 2,3 -1,1 20,0 2Q 12,4 -2,1 3,8 -1,1 13,0 3Q 0,0 4Q 0,0 Totalt YTD 31,7 -2,7 6,1 -2,1 33,0 2006 Scandinavia Western-Europe Consumer financing Eliminations/ unallocated Operating revenue * 1Q 495,6 64,5 0,7 -1,1 559,8 2Q 387,2 50,1 1,3 -1,3 437,3 3Q 513,7 52,7 2,0 -1,0 567,4 4Q 606,9 75,7 3,2 -0,7 685,0 Totalt YTD 2 003,4 243,0 7,2 -4,1 2 249,4 EBIT 1Q 24,1 -1,7 -0,3 -0,7 21,4 2Q 19,3 -2,9 0,0 -0,5 15,9 3Q 20,4 -2,2 0,5 -0,5 18,2 4Q 29,6 0,3 0,7 -0,3 30,4 Totalt YTD 93,4 -6,6 0,9 -2,0 85,9 * The table shows the segment's operating revenue including revenue from sales to group companies in other segments. This revenue is eliminated in the consolidated figures. On 30 April, Komplett acquired approx. 98 per cent of the shares in inWarehouse AB in return for a cash consideration. The net cost of the shares (including transaction costs) totalled MNOK 153.9. inWarehouse is engaged in the same type of activities as Komplett is in Sweden. Had the acquisition not taken place, the <strong>Group</strong> would have posted operating revenues of MNOK 537 and an operating profit of MNOK 19.6. The quarterly accounts have been prepared on the basis of the same principles as the annual accounts. The quarterly report has been produced in accordance with IAS 34 on interim reporting. Please refer to the company's website at www.komplett.com and the Oslo Stock Exchange for presentations showing corporate development trends since 2001. 261 Total Eliminations/ unallocated Total QUARTERLY RESULTS 2007 1Q 2Q 3Q 4Q 2007 Operating revenue 663,3 633,5 1296,8 EBIT 20,0 13,0 33,0 EBT 21,7 14,4 36,2 Profit margin 3,3 % 2,3 % 2,8 % Post-tax EPS (NOK) 1,3 0,7 2,0 EPS diluted (NOK) 1,3 0,7 2,0 Number of shares (million) 12,06 12,74 12,40 QUARTERLY RESULTS 2006 1Q 2Q 3Q 4Q 2006 Operating revenue 559,8 437,3 567,4 685,0 2249,4 EBIT 21,4 15,9 18,2 30,4 85,9 EBT 22,7 17,5 21,3 33,0 94,5 Profit margin 4,1 % 4,0 % 3,8 % 4,8 % 4,2 % Post-tax EPS (NOK) 1,3 1,0 1,2 2,0 5,5 EPS diluted (NOK) 1,3 1,0 1,2 2,0 5,5 Number of shares (million) 12,06 12,06 12,06 12,06 12,06
- Page 1 and 2:
INFORMATION MEMORANDUM in connectio
- Page 3 and 4:
TABLE OF CONTENTS 3 INFORMATION MEM
- Page 5 and 6:
5 INFORMATION MEMORANDUM Merger of
- Page 7 and 8:
7 INFORMATION MEMORANDUM Merger of
- Page 9 and 10:
9 INFORMATION MEMORANDUM Merger of
- Page 11 and 12:
11 INFORMATION MEMORANDUM Merger of
- Page 13 and 14:
13 INFORMATION MEMORANDUM Merger of
- Page 15 and 16:
15 INFORMATION MEMORANDUM Merger of
- Page 17 and 18:
17 INFORMATION MEMORANDUM Merger of
- Page 19 and 20:
19 INFORMATION MEMORANDUM Merger of
- Page 21 and 22:
21 INFORMATION MEMORANDUM Merger of
- Page 23 and 24:
Lars Seeberg, Manager TCG 23 INFORM
- Page 25 and 26:
25 INFORMATION MEMORANDUM Merger of
- Page 27 and 28:
27 INFORMATION MEMORANDUM Merger of
- Page 29 and 30:
29 INFORMATION MEMORANDUM Merger of
- Page 31 and 32:
31 INFORMATION MEMORANDUM Merger of
- Page 33 and 34:
Full year 2006 Figures in NOK milli
- Page 35 and 36:
35 INFORMATION MEMORANDUM Merger of
- Page 37 and 38:
37 INFORMATION MEMORANDUM Merger of
- Page 39 and 40:
39 INFORMATION MEMORANDUM Merger of
- Page 41 and 42:
41 INFORMATION MEMORANDUM Merger of
- Page 43 and 44:
2004 Investments in the period amou
- Page 45 and 46:
45 INFORMATION MEMORANDUM Merger of
- Page 47 and 48:
47 INFORMATION MEMORANDUM Merger of
- Page 49 and 50:
49 INFORMATION MEMORANDUM Merger of
- Page 51 and 52:
51 INFORMATION MEMORANDUM Merger of
- Page 53 and 54:
6.19.3 Balance Sheet Figures in NOK
- Page 55 and 56:
55 INFORMATION MEMORANDUM Merger of
- Page 57 and 58:
57 INFORMATION MEMORANDUM Merger of
- Page 59 and 60:
59 INFORMATION MEMORANDUM Merger of
- Page 61 and 62:
Share capital per 01.01.2004 5 910
- Page 63 and 64:
7 INFORMATION ABOUT TCG 63 INFORMAT
- Page 65 and 66:
65 INFORMATION MEMORANDUM Merger of
- Page 67 and 68:
67 INFORMATION MEMORANDUM Merger of
- Page 69 and 70:
Figure: People having purchased pro
- Page 71 and 72:
71 INFORMATION MEMORANDUM Merger of
- Page 73 and 74:
73 INFORMATION MEMORANDUM Merger of
- Page 75 and 76:
75 INFORMATION MEMORANDUM Merger of
- Page 77 and 78:
77 INFORMATION MEMORANDUM Merger of
- Page 79 and 80:
Appendix 1: Merger Plan with append
- Page 81 and 82:
CONTENTS Page 1 BACKGROUND ........
- Page 83 and 84:
MERGER PLAN This merger plan is ent
- Page 85 and 86:
) The share capital in Komplett is
- Page 87 and 88:
8 PROPOSALS FOR AMENDMENTS TO THE A
- Page 89 and 90:
16 DISTRIBUTION TO SHAREHOLDERS Non
- Page 91 and 92:
Appendices Appendix 1 Articles of A
- Page 93 and 94:
Articles of Association for KOMPLET
- Page 95 and 96:
Articles of Association for TORP CO
- Page 97 and 98:
Articles of Association for KOMPLET
- Page 100 and 101:
100
- Page 102 and 103:
102
- Page 104 and 105:
104
- Page 106 and 107:
106
- Page 108 and 109:
108
- Page 110 and 111:
110
- Page 112 and 113:
112
- Page 114 and 115:
114
- Page 116 and 117:
116
- Page 118 and 119:
118
- Page 120 and 121:
120
- Page 122 and 123:
122
- Page 124 and 125:
124
- Page 126 and 127:
126
- Page 128 and 129:
128
- Page 130 and 131:
130
- Page 132 and 133:
132
- Page 134 and 135:
134
- Page 136 and 137:
136
- Page 138 and 139:
138
- Page 140 and 141:
140
- Page 142 and 143:
142
- Page 144 and 145:
144
- Page 146 and 147:
146
- Page 148 and 149:
148
- Page 150 and 151:
150
- Page 152 and 153:
152
- Page 154 and 155:
154
- Page 156 and 157:
156
- Page 158 and 159:
158
- Page 160 and 161:
160
- Page 162 and 163:
162
- Page 164 and 165:
164
- Page 166 and 167:
166
- Page 168 and 169:
168
- Page 170 and 171:
170
- Page 172 and 173:
172
- Page 174 and 175:
174
- Page 176 and 177:
176
- Page 178 and 179:
178
- Page 180 and 181:
180
- Page 182 and 183:
182
- Page 184 and 185:
The Board of Director’s Annual Re
- Page 186 and 187:
Financial risk The Group is exposed
- Page 188 and 189:
Translated into English for informa
- Page 190 and 191:
Translated into English for informa
- Page 192 and 193:
Torp Computing Group ASA Short-term
- Page 194 and 195:
Torp Computing Group ASA Auditor Th
- Page 196 and 197:
Torp Computing Group ASA Note 7 Sub
- Page 198 and 199:
Torp Computing Group ASA Note 14 Sh
- Page 200 and 201:
200
- Page 202 and 203:
202
- Page 204 and 205:
204
- Page 206 and 207:
206
- Page 208 and 209:
208
- Page 210 and 211: 210
- Page 212 and 213: 212
- Page 214 and 215: 214
- Page 216 and 217: 216
- Page 218 and 219: 218
- Page 220 and 221: 220
- Page 222 and 223: Appendix 6 Interim balance sheet fo
- Page 224 and 225: Komplett ASA INTERIM BALANCE SHEET
- Page 226 and 227: Appendix 7 Interim balance sheet fo
- Page 228 and 229: Torp Computing Group ASA Equity and
- Page 230 and 231: Appendix 8 Draft opening balance sh
- Page 232 and 233: Komplett ASA Draft Opening balance
- Page 234 and 235: 234
- Page 236 and 237: REPORT OF THE BOARD OF DIRECTORS CO
- Page 238 and 239: The exchange ratio for the Merger w
- Page 240 and 241: UNOFFICIAL TRANSLATION FROM NORWEGI
- Page 242 and 243: UNOFFICIAL TRANSLATION FROM NORWEGI
- Page 244 and 245: Appendix 3: Expert Statements on th
- Page 246 and 247: 246
- Page 248 and 249: 248
- Page 250 and 251: Appendix 5: Financial statements fo
- Page 252 and 253: Trend, active customers (number) 1Q
- Page 254 and 255: THE KOMPLETT GROUP JANUARY - MARCH
- Page 256 and 257: KOMPLETT REPORTS 45 PER CENT GROWTH
- Page 258 and 259: Business development/operations Kom
- Page 262 and 263: Appendix 6: Summary of Fairness Opi
- Page 264 and 265: 28 August 2007 Strictly confidentia
- Page 266 and 267: Appendix 7: Summary of Fairness Opi
- Page 268 and 269: 28 August 2007 consummated. TCG and