Torp Computing Group ASA
Torp Computing Group ASA
Torp Computing Group ASA

Create successful ePaper yourself
Turn your PDF publications into a flip-book with our unique Google optimized e-Paper software.
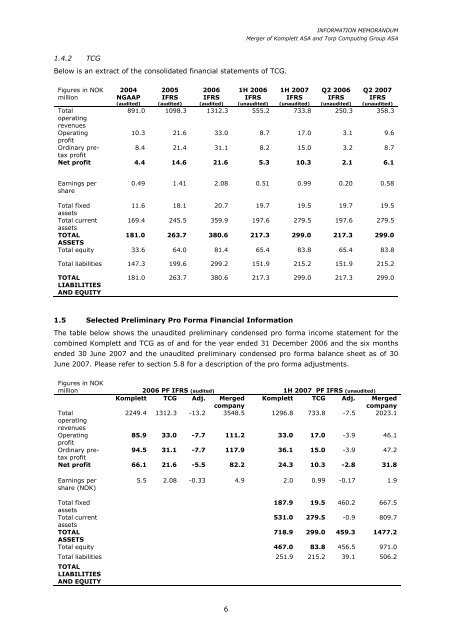
1.4.2 TCG<br />
Below is an extract of the consolidated financial statements of TCG.<br />
Figures in NOK<br />
million<br />
2004<br />
NGAAP<br />
(audited)<br />
2005<br />
IFRS<br />
(audited)<br />
2006<br />
IFRS<br />
(audited)<br />
6<br />
INFORMATION MEMORANDUM<br />
Merger of Komplett <strong>ASA</strong> and <strong>Torp</strong> <strong>Computing</strong> <strong>Group</strong> <strong>ASA</strong><br />
1H 2006<br />
IFRS<br />
(unaudited)<br />
1H 2007<br />
IFRS<br />
(unaudited)<br />
Q2 2006<br />
IFRS<br />
(unaudited)<br />
Q2 2007<br />
IFRS<br />
(unaudited)<br />
Total<br />
operating<br />
revenues<br />
891.0 1098.3 1312.3 555.2 733.8 250.3 358.3<br />
Operating<br />
profit<br />
10.3 21.6 33.0 8.7 17.0 3.1 9.6<br />
Ordinary pretax<br />
profit<br />
8.4 21.4 31.1 8.2 15.0 3.2 8.7<br />
Net profit 4.4 14.6 21.6 5.3 10.3 2.1 6.1<br />
Earnings per<br />
share<br />
0.49 1.41 2.08 0.51 0.99 0.20 0.58<br />
Total fixed<br />
assets<br />
11.6 18.1 20.7 19.7 19.5 19.7 19.5<br />
Total current<br />
assets<br />
169.4 245.5 359.9 197.6 279.5 197.6 279.5<br />
TOTAL<br />
ASSETS<br />
181.0 263.7 380.6 217.3 299.0 217.3 299.0<br />
Total equity 33.6 64.0 81.4 65.4 83.8 65.4 83.8<br />
Total liabilities 147.3 199.6 299.2 151.9 215.2 151.9 215.2<br />
TOTAL<br />
LIABILITIES<br />
AND EQUITY<br />
181.0 263.7 380.6 217.3 299.0 217.3 299.0<br />
1.5 Selected Preliminary Pro Forma Financial Information<br />
The table below shows the unaudited preliminary condensed pro forma income statement for the<br />
combined Komplett and TCG as of and for the year ended 31 December 2006 and the six months<br />
ended 30 June 2007 and the unaudited preliminary condensed pro forma balance sheet as of 30<br />
June 2007. Please refer to section 5.8 for a description of the pro forma adjustments.<br />
Figures in NOK<br />
million 2006 PF IFRS (audited) 1H 2007 PF IFRS (unaudited)<br />
Komplett TCG Adj. Merged Komplett TCG Adj. Merged<br />
company<br />
company<br />
Total<br />
operating<br />
revenues<br />
2249.4 1312.3 -13.2 3548.5 1296.8 733.8 -7.5 2023.1<br />
Operating<br />
profit<br />
85.9 33.0 -7.7 111.2 33.0 17.0 -3.9 46.1<br />
Ordinary pretax<br />
profit<br />
94.5 31.1 -7.7 117.9 36.1 15.0 -3.9 47.2<br />
Net profit 66.1 21.6 -5.5 82.2 24.3 10.3 -2.8 31.8<br />
Earnings per<br />
share (NOK)<br />
5.5 2.08 -0.33 4.9 2.0 0.99 -0.17 1.9<br />
Total fixed<br />
assets<br />
187.9 19.5 460.2 667.5<br />
Total current<br />
assets<br />
531.0 279.5 -0.9 809.7<br />
TOTAL<br />
ASSETS<br />
718.9 299.0 459.3 1477.2<br />
Total equity 467.0 83.8 456.5 971.0<br />
Total liabilities<br />
TOTAL<br />
LIABILITIES<br />
AND EQUITY<br />
251.9 215.2 39.1 506.2