Torp Computing Group ASA
Torp Computing Group ASA
Torp Computing Group ASA

You also want an ePaper? Increase the reach of your titles
YUMPU automatically turns print PDFs into web optimized ePapers that Google loves.
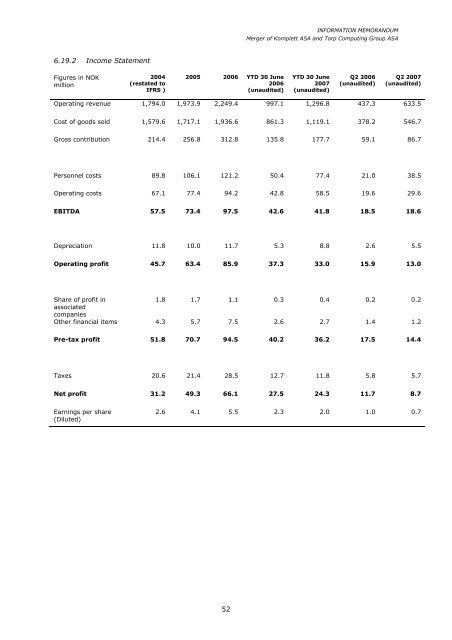
6.19.2 Income Statement<br />
Figures in NOK<br />
million<br />
2004<br />
(restated to<br />
IFRS )<br />
2005 2006 YTD 30 June<br />
2006<br />
(unaudited)<br />
52<br />
INFORMATION MEMORANDUM<br />
Merger of Komplett <strong>ASA</strong> and <strong>Torp</strong> <strong>Computing</strong> <strong>Group</strong> <strong>ASA</strong><br />
YTD 30 June<br />
2007<br />
(unaudited)<br />
Q2 2006<br />
(unaudited)<br />
Q2 2007<br />
(unaudited)<br />
Operating revenue 1,794.0 1,973.9 2,249.4 997.1 1,296.8 437.3 633.5<br />
Cost of goods sold 1,579.6 1,717.1 1,936.6 861.3 1,119.1 378.2 546.7<br />
Gross contribution 214.4 256.8 312.8 135.8 177.7 59.1 86.7<br />
Personnel costs 89.8 106.1 121.2 50.4 77.4 21.0 38.5<br />
Operating costs 67.1 77.4 94.2 42.8 58.5 19.6 29.6<br />
EBITDA 57.5 73.4 97.5 42.6 41.8 18.5 18.6<br />
Depreciation 11.8 10.0 11.7 5.3 8.8 2.6 5.5<br />
Operating profit 45.7 63.4 85.9 37.3 33.0 15.9 13.0<br />
Share of profit in<br />
associated<br />
companies<br />
1.8 1.7 1.1 0.3 0.4 0.2 0.2<br />
Other financial items 4.3 5.7 7.5 2.6 2.7 1.4 1.2<br />
Pre-tax profit 51.8 70.7 94.5 40.2 36.2 17.5 14.4<br />
Taxes 20.6 21.4 28.5 12.7 11.8 5.8 5.7<br />
Net profit 31.2 49.3 66.1 27.5 24.3 11.7 8.7<br />
Earnings per share<br />
(Diluted)<br />
2.6 4.1 5.5 2.3 2.0 1.0 0.7