

in the First Half of 2003 98th Fiscal Year - FIAT SpA
in the First Half of 2003 98th Fiscal Year - FIAT SpA
in the First Half of 2003 98th Fiscal Year - FIAT SpA

Create successful ePaper yourself
Turn your PDF publications into a flip-book with our unique Google optimized e-Paper software.
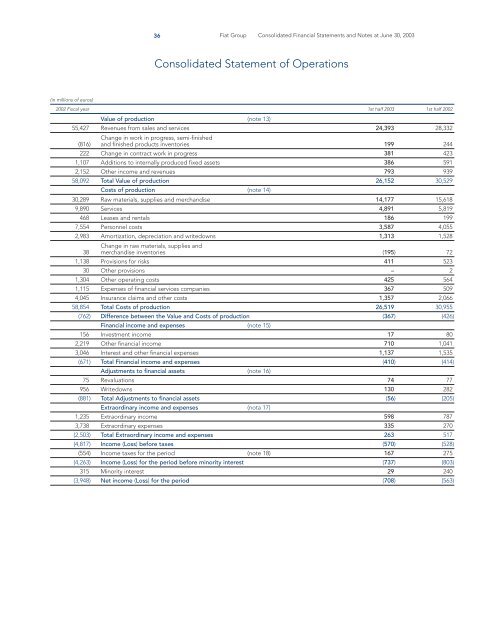
(<strong>in</strong> millions <strong>of</strong> euros)<br />
36 Fiat Group Consolidated F<strong>in</strong>ancial Statements and Notes at June 30, <strong>2003</strong><br />
Consolidated Statement <strong>of</strong> Operations<br />
2002 <strong>Fiscal</strong> year 1st half <strong>2003</strong> 1st half 2002<br />
Value <strong>of</strong> production (note 13)<br />
55,427 Revenues from sales and services<br />
Change <strong>in</strong> work <strong>in</strong> progress, semi-f<strong>in</strong>ished<br />
24,393 28,332<br />
(816) and f<strong>in</strong>ished products <strong>in</strong>ventories 199 244<br />
222 Change <strong>in</strong> contract work <strong>in</strong> progress 381 423<br />
1,107 Additions to <strong>in</strong>ternally produced fixed assets 386 591<br />
2,152 O<strong>the</strong>r <strong>in</strong>come and revenues 793 939<br />
58,092 Total Value <strong>of</strong> production 26,152 30,529<br />
Costs <strong>of</strong> production (note 14)<br />
30,289 Raw materials, supplies and merchandise 14,177 15,618<br />
9,890 Services 4,891 5,819<br />
468 Leases and rentals 186 199<br />
7,554 Personnel costs 3,587 4,055<br />
2,983 Amortization, depreciation and writedowns<br />
Change <strong>in</strong> raw materials, supplies and<br />
1,313 1,528<br />
38 merchandise <strong>in</strong>ventories (195) 72<br />
1,138 Provisions for risks 411 523<br />
30 O<strong>the</strong>r provisions – 2<br />
1,304 O<strong>the</strong>r operat<strong>in</strong>g costs 425 564<br />
1,115 Expenses <strong>of</strong> f<strong>in</strong>ancial services companies 367 509<br />
4,045 Insurance claims and o<strong>the</strong>r costs 1,357 2,066<br />
58,854 Total Costs <strong>of</strong> production 26,519 30,955<br />
(762) Difference between <strong>the</strong> Value and Costs <strong>of</strong> production (367) (426)<br />
F<strong>in</strong>ancial <strong>in</strong>come and expenses (note 15)<br />
156 Investment <strong>in</strong>come 17 80<br />
2,219 O<strong>the</strong>r f<strong>in</strong>ancial <strong>in</strong>come 710 1,041<br />
3,046 Interest and o<strong>the</strong>r f<strong>in</strong>ancial expenses 1,137 1,535<br />
(671) Total F<strong>in</strong>ancial <strong>in</strong>come and expenses (410) (414)<br />
Adjustments to f<strong>in</strong>ancial assets (note 16)<br />
75 Revaluations 74 77<br />
956 Writedowns 130 282<br />
(881) Total Adjustments to f<strong>in</strong>ancial assets (56) (205)<br />
Extraord<strong>in</strong>ary <strong>in</strong>come and expenses (nota 17)<br />
1,235 Extraord<strong>in</strong>ary <strong>in</strong>come 598 787<br />
3,738 Extraord<strong>in</strong>ary expenses 335 270<br />
(2,503) Total Extraord<strong>in</strong>ary <strong>in</strong>come and expenses 263 517<br />
(4,817) Income (Loss) before taxes (570) (528)<br />
(554) Income taxes for <strong>the</strong> period (note 18) 167 275<br />
(4,263) Income (Loss) for <strong>the</strong> period before m<strong>in</strong>ority <strong>in</strong>terest (737) (803)<br />
315 M<strong>in</strong>ority <strong>in</strong>terest 29 240<br />
(3,948) Net <strong>in</strong>come (Loss) for <strong>the</strong> period (708) (563)


