

in the First Half of 2003 98th Fiscal Year - FIAT SpA
in the First Half of 2003 98th Fiscal Year - FIAT SpA
in the First Half of 2003 98th Fiscal Year - FIAT SpA

You also want an ePaper? Increase the reach of your titles
YUMPU automatically turns print PDFs into web optimized ePapers that Google loves.
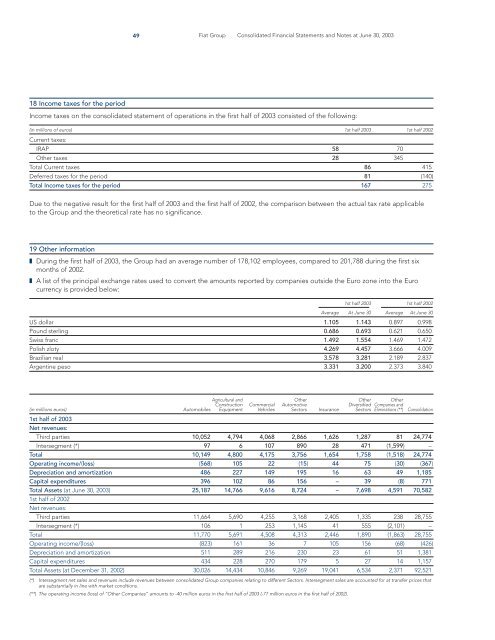
18 Income taxes for <strong>the</strong> period<br />
Income taxes on <strong>the</strong> consolidated statement <strong>of</strong> operations <strong>in</strong> <strong>the</strong> first half <strong>of</strong> <strong>2003</strong> consisted <strong>of</strong> <strong>the</strong> follow<strong>in</strong>g:<br />
(<strong>in</strong> millions <strong>of</strong> euros) 1st half <strong>2003</strong> 1st half 2002<br />
Current taxes:<br />
49 Fiat Group Consolidated F<strong>in</strong>ancial Statements and Notes at June 30, <strong>2003</strong><br />
IRAP 58 70<br />
O<strong>the</strong>r taxes 28 345<br />
Total Current taxes 86 415<br />
Deferred taxes for <strong>the</strong> period 81 (140)<br />
Total Income taxes for <strong>the</strong> period 167 275<br />
Due to <strong>the</strong> negative result for <strong>the</strong> first half <strong>of</strong> <strong>2003</strong> and <strong>the</strong> first half <strong>of</strong> 2002, <strong>the</strong> comparison between <strong>the</strong> actual tax rate applicable<br />
to <strong>the</strong> Group and <strong>the</strong> <strong>the</strong>oretical rate has no significance.<br />
19 O<strong>the</strong>r <strong>in</strong>formation<br />
❚ Dur<strong>in</strong>g <strong>the</strong> first half <strong>of</strong> <strong>2003</strong>, <strong>the</strong> Group had an average number <strong>of</strong> 178,102 employees, compared to 201,788 dur<strong>in</strong>g <strong>the</strong> first six<br />
months <strong>of</strong> 2002.<br />
❚ A list <strong>of</strong> <strong>the</strong> pr<strong>in</strong>cipal exchange rates used to convert <strong>the</strong> amounts reported by companies outside <strong>the</strong> Euro zone <strong>in</strong>to <strong>the</strong> Euro<br />
currency is provided below:<br />
1st half <strong>2003</strong> 1st half 2002<br />
Average At June 30 Average At June 30<br />
US dollar 1.105 1.143 0.897 0.998<br />
Pound sterl<strong>in</strong>g 0.686 0.693 0.621 0.650<br />
Swiss franc 1.492 1.554 1.469 1.472<br />
Polish zloty 4.269 4.457 3.666 4.009<br />
Brazilian real 3.578 3.281 2.189 2.837<br />
Argent<strong>in</strong>e peso 3.331 3.200 2.373 3.840<br />
Agricultural and O<strong>the</strong>r O<strong>the</strong>r O<strong>the</strong>r<br />
Construction Commercial Automotive Diversified Companies and<br />
(<strong>in</strong> millions euros)<br />
1st half <strong>of</strong> <strong>2003</strong><br />
Net revenues:<br />
Automobiles Equipment Vehicles Sectors Insurance Sectors Elim<strong>in</strong>ations (**) Consolidation<br />
Third parties 10,052 4,794 4,068 2,866 1,626 1,287 81 24,774<br />
Intersegment (*) 97 6 107 890 28 471 (1,599) –<br />
Total 10,149 4,800 4,175 3,756 1,654 1,758 (1,518) 24,774<br />
Operat<strong>in</strong>g <strong>in</strong>come/(loss) (568) 105 22 (15) 44 75 (30) (367)<br />
Depreciation and amortization 486 227 149 195 16 63 49 1,185<br />
Capital expenditures 396 102 86 156 – 39 (8) 771<br />
Total Assets (at June 30, <strong>2003</strong>)<br />
1st half <strong>of</strong> 2002<br />
Net revenues:<br />
25,187 14,766 9,616 8,724 – 7,698 4,591 70,582<br />
Third parties 11,664 5,690 4,255 3,168 2,405 1,335 238 28,755<br />
Intersegment (*) 106 1 253 1,145 41 555 (2,101) –<br />
Total 11,770 5,691 4,508 4,313 2,446 1,890 (1,863) 28,755<br />
Operat<strong>in</strong>g <strong>in</strong>come/(loss) (823) 161 36 7 105 156 (68) (426)<br />
Depreciation and amortization 511 289 216 230 23 61 51 1,381<br />
Capital expenditures 434 228 270 179 5 27 14 1,157<br />
Total Assets (at December 31, 2002) 30,026 14,434 10,846 9,269 19,041 6,534 2,371 92,521<br />
(*) Intersegment net sales and revenues <strong>in</strong>clude revenues between consolidated Group companies relat<strong>in</strong>g to different Sectors. Intersegment sales are accounted for at transfer prices that<br />
are substantially <strong>in</strong> l<strong>in</strong>e with market conditions.<br />
(**) The operat<strong>in</strong>g <strong>in</strong>come (loss) <strong>of</strong> “O<strong>the</strong>r Companies” amounts to -40 million euros <strong>in</strong> <strong>the</strong> first half <strong>of</strong> <strong>2003</strong> (-77 million euros <strong>in</strong> <strong>the</strong> first half <strong>of</strong> 2002).


