

in the First Half of 2003 98th Fiscal Year - FIAT SpA
in the First Half of 2003 98th Fiscal Year - FIAT SpA
in the First Half of 2003 98th Fiscal Year - FIAT SpA

Create successful ePaper yourself
Turn your PDF publications into a flip-book with our unique Google optimized e-Paper software.
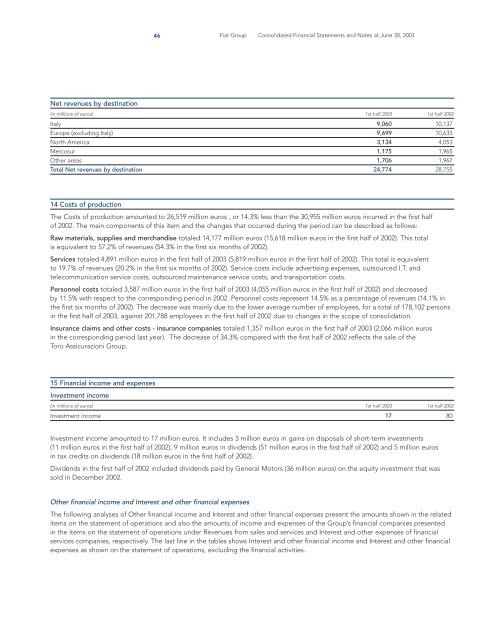
Net revenues by dest<strong>in</strong>ation<br />
(<strong>in</strong> millions <strong>of</strong> euros) 1st half <strong>2003</strong> 1st half 2002<br />
Italy 9,060 10,137<br />
Europe (exclud<strong>in</strong>g Italy) 9,699 10,633<br />
North America 3,134 4,053<br />
Mercosur 1,175 1,965<br />
O<strong>the</strong>r areas 1,706 1,967<br />
Total Net revenues by dest<strong>in</strong>ation 24,774 28,755<br />
14 Costs <strong>of</strong> production<br />
The Costs <strong>of</strong> production amounted to 26,519 million euros , or 14.3% less than <strong>the</strong> 30,955 million euros <strong>in</strong>curred <strong>in</strong> <strong>the</strong> first half<br />
<strong>of</strong> 2002. The ma<strong>in</strong> components <strong>of</strong> this item and <strong>the</strong> changes that occurred dur<strong>in</strong>g <strong>the</strong> period can be described as follows:<br />
Raw materials, supplies and merchandise totaled 14,177 million euros (15,618 million euros <strong>in</strong> <strong>the</strong> first half <strong>of</strong> 2002). This total<br />
is equivalent to 57.2% <strong>of</strong> revenues (54.3% <strong>in</strong> <strong>the</strong> first six months <strong>of</strong> 2002).<br />
Services totaled 4,891 million euros <strong>in</strong> <strong>the</strong> first half <strong>of</strong> <strong>2003</strong> (5,819 million euros <strong>in</strong> <strong>the</strong> first half <strong>of</strong> 2002). This total is equivalent<br />
to 19.7% <strong>of</strong> revenues (20.2% <strong>in</strong> <strong>the</strong> first six months <strong>of</strong> 2002). Service costs <strong>in</strong>clude advertis<strong>in</strong>g expenses, outsourced I.T. and<br />
telecommunication service costs, outsourced ma<strong>in</strong>tenance service costs, and transportation costs.<br />
Personnel costs totaled 3,587 million euros <strong>in</strong> <strong>the</strong> first half <strong>of</strong> <strong>2003</strong> (4,055 million euros <strong>in</strong> <strong>the</strong> first half <strong>of</strong> 2002) and decreased<br />
by 11.5% with respect to <strong>the</strong> correspond<strong>in</strong>g period <strong>in</strong> 2002. Personnel costs represent 14.5% as a percentage <strong>of</strong> revenues (14.1% <strong>in</strong><br />
<strong>the</strong> first six months <strong>of</strong> 2002). The decrease was ma<strong>in</strong>ly due to <strong>the</strong> lower average number <strong>of</strong> employees, for a total <strong>of</strong> 178,102 persons<br />
<strong>in</strong> <strong>the</strong> first half <strong>of</strong> <strong>2003</strong>, aga<strong>in</strong>st 201,788 employees <strong>in</strong> <strong>the</strong> first half <strong>of</strong> 2002 due to changes <strong>in</strong> <strong>the</strong> scope <strong>of</strong> consolidation.<br />
Insurance claims and o<strong>the</strong>r costs - <strong>in</strong>surance companies totaled 1,357 million euros <strong>in</strong> <strong>the</strong> first half <strong>of</strong> <strong>2003</strong> (2,066 million euros<br />
<strong>in</strong> <strong>the</strong> correspond<strong>in</strong>g period last year). The decrease <strong>of</strong> 34.3% compared with <strong>the</strong> first half <strong>of</strong> 2002 reflects <strong>the</strong> sale <strong>of</strong> <strong>the</strong><br />
Toro Assicurazioni Group.<br />
15 F<strong>in</strong>ancial <strong>in</strong>come and expenses<br />
Investment <strong>in</strong>come<br />
46 Fiat Group Consolidated F<strong>in</strong>ancial Statements and Notes at June 30, <strong>2003</strong><br />
(<strong>in</strong> millions <strong>of</strong> euros) 1st half <strong>2003</strong> 1st half 2002<br />
Investment <strong>in</strong>come 17 80<br />
Investment <strong>in</strong>come amounted to 17 million euros. It <strong>in</strong>cludes 3 million euros <strong>in</strong> ga<strong>in</strong>s on disposals <strong>of</strong> short-term <strong>in</strong>vestments<br />
(11 million euros <strong>in</strong> <strong>the</strong> first half <strong>of</strong> 2002), 9 million euros <strong>in</strong> dividends (51 million euros <strong>in</strong> <strong>the</strong> first half <strong>of</strong> 2002) and 5 million euros<br />
<strong>in</strong> tax credits on dividends (18 million euros <strong>in</strong> <strong>the</strong> first half <strong>of</strong> 2002).<br />
Dividends <strong>in</strong> <strong>the</strong> first half <strong>of</strong> 2002 <strong>in</strong>cluded dividends paid by General Motors (36 million euros) on <strong>the</strong> equity <strong>in</strong>vestment that was<br />
sold <strong>in</strong> December 2002.<br />
O<strong>the</strong>r f<strong>in</strong>ancial <strong>in</strong>come and Interest and o<strong>the</strong>r f<strong>in</strong>ancial expenses<br />
The follow<strong>in</strong>g analyses <strong>of</strong> O<strong>the</strong>r f<strong>in</strong>ancial <strong>in</strong>come and Interest and o<strong>the</strong>r f<strong>in</strong>ancial expenses present <strong>the</strong> amounts shown <strong>in</strong> <strong>the</strong> related<br />
items on <strong>the</strong> statement <strong>of</strong> operations and also <strong>the</strong> amounts <strong>of</strong> <strong>in</strong>come and expenses <strong>of</strong> <strong>the</strong> Group’s f<strong>in</strong>ancial companies presented<br />
<strong>in</strong> <strong>the</strong> items on <strong>the</strong> statement <strong>of</strong> operations under Revenues from sales and services and Interest and o<strong>the</strong>r expenses <strong>of</strong> f<strong>in</strong>ancial<br />
services companies, respectively. The last l<strong>in</strong>e <strong>in</strong> <strong>the</strong> tables shows Interest and o<strong>the</strong>r f<strong>in</strong>ancial <strong>in</strong>come and Interest and o<strong>the</strong>r f<strong>in</strong>ancial<br />
expenses as shown on <strong>the</strong> statement <strong>of</strong> operations, exclud<strong>in</strong>g <strong>the</strong> f<strong>in</strong>ancial activities.


