7th Workshop on Forest Fire Management - EARSeL, European ...
7th Workshop on Forest Fire Management - EARSeL, European ...
7th Workshop on Forest Fire Management - EARSeL, European ...

Create successful ePaper yourself
Turn your PDF publications into a flip-book with our unique Google optimized e-Paper software.
Analysis of CO emissi<strong>on</strong>s, by forest fires, in the Iberian Peninsula 163<br />
December 2008), N is the total number of data, n is the ordinal of the harm<strong>on</strong>ic<br />
used and F real (n) and F imag (n) are the two coefficients of harm<strong>on</strong>ic<br />
determined through the FFT. Figure 1 shows in grey colour the original data<br />
of the series used; the c<strong>on</strong>tinuous line superposed represents Inverse FFT.<br />
By means of the FFT, we have also determined the harm<strong>on</strong>ics of the data<br />
series for each year and regi<strong>on</strong>. Thus, the curve which establishes the reference<br />
level is determined through the inverse Fourier transform and by<br />
using the group of harm<strong>on</strong>ics that retrieve the general behaviour of data.<br />
Once the adjustment between both curves was carried out, we superimposed<br />
the inverse Fourier transform using further groups of harm<strong>on</strong>ics to<br />
retrieve c<strong>on</strong>crete behaviours. Figure 2 shows all the curves involved in the<br />
process described as well as the temporal situati<strong>on</strong> of the fires. The figure<br />
corresp<strong>on</strong>ds to the real case of the regi<strong>on</strong> of Castilla y León, year 2005. The<br />
regi<strong>on</strong>’s annual curve is labelled as “yearly curve smoothed” and it has been<br />
reproduced through the harm<strong>on</strong>ic groups: [1-3] and [360-364]; the peninsular<br />
synoptic curve of reference was adjusted during the spring seas<strong>on</strong>,<br />
and it appears as “adjusted synoptic curve”, eq. (4); finally, the curve that<br />
reproduces the local variati<strong>on</strong>s of the CO total column appears as “yearly<br />
curve reproducing data behaviour” and it has been c<strong>on</strong>structed with harm<strong>on</strong>ic<br />
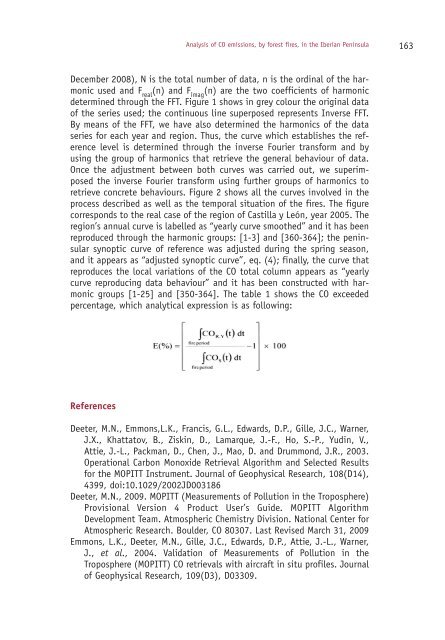
groups [1-25] and [350-364]. The table 1 shows the CO exceeded<br />
percentage, which analytical expressi<strong>on</strong> is as following:<br />
References<br />
Deeter, M.N., Emm<strong>on</strong>s,L.K., Francis, G.L., Edwards, D.P., Gille, J.C., Warner,<br />
J.X., Khattatov, B., Ziskin, D., Lamarque, J.-F., Ho, S.-P., Yudin, V.,<br />
Attie, J.-L., Packman, D., Chen, J., Mao, D. and Drumm<strong>on</strong>d, J.R., 2003.<br />
Operati<strong>on</strong>al Carb<strong>on</strong> M<strong>on</strong>oxide Retrieval Algorithm and Selected Results<br />
for the MOPITT Instrument. Journal of Geophysical Research, 108(D14),<br />
4399, doi:10.1029/2002JD003186<br />
Deeter, M.N., 2009. MOPITT (Measurements of Polluti<strong>on</strong> in the Troposphere)<br />
Provisi<strong>on</strong>al Versi<strong>on</strong> 4 Product User’s Guide. MOPITT Algorithm<br />
Development Team. Atmospheric Chemistry Divisi<strong>on</strong>. Nati<strong>on</strong>al Center for<br />
Atmospheric Research. Boulder, CO 80307. Last Revised March 31, 2009<br />
Emm<strong>on</strong>s, L.K., Deeter, M.N., Gille, J.C., Edwards, D.P., Attie, J.-L., Warner,<br />
J., et al., 2004. Validati<strong>on</strong> of Measurements of Polluti<strong>on</strong> in the<br />
Troposphere (MOPITT) CO retrievals with aircraft in situ profiles. Journal<br />
of Geophysical Research, 109(D3), D03309.