Annual Report 1997/1998 - Munich Re
Annual Report 1997/1998 - Munich Re
Annual Report 1997/1998 - Munich Re

You also want an ePaper? Increase the reach of your titles
YUMPU automatically turns print PDFs into web optimized ePapers that Google loves.
<strong>Munich</strong> <strong>Re</strong> <strong><strong>Re</strong>port</strong> of the Board of Management<br />
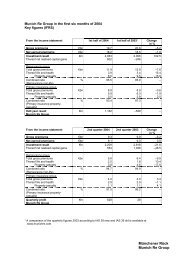
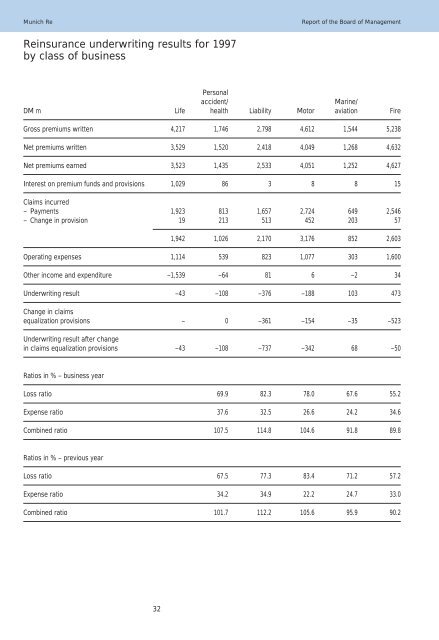
<strong>Re</strong>insurance underwriting results for <strong>1997</strong><br />
by class of business<br />
Personal<br />
accident/ Marine/<br />
DM m Life health Liability Motor aviation Fire<br />
Gross premiums written 4,217 1,746 2,798 4,612 1,544 5,238<br />
Net premiums written 3,529 1,520 2,418 4,049 1,268 4,632<br />
Net premiums earned 3,523 1,435 2,533 4,051 1,252 4,627<br />
Interest on premium funds and provisions 1,029 86 3 8 8 15<br />
Claims incurred<br />
– Payments 1,923 813 1,657 2,724 649 2,546<br />
– Change in provision 19 213 513 452 203 57<br />
32<br />
1,942 1,026 2,170 3,176 852 2,603<br />
Operating expenses 1,114 539 823 1,077 303 1,600<br />
Other income and expenditure –1,539 –64 81 6 –2 34<br />
Underwriting result –43 –108 –376 –188 103 473<br />
Change in claims<br />
equalization provisions – 0 –361 –154 –35 –523<br />
Underwriting result after change<br />
in claims equalization provisions –43 –108 –737 –342 68 –50<br />
Ratios in % – business year<br />
Loss ratio 69.9 82.3 78.0 67.6 55.2<br />
Expense ratio 37.6 32.5 26.6 24.2 34.6<br />
Combined ratio 107.5 114.8 104.6 91.8 89.8<br />
Ratios in % – previous year<br />
Loss ratio 67.5 77.3 83.4 71.2 57.2<br />
Expense ratio 34.2 34.9 22.2 24.7 33.0<br />
Combined ratio 101.7 112.2 105.6 95.9 90.2