Annual Report 1997/1998 - Munich Re
Annual Report 1997/1998 - Munich Re
Annual Report 1997/1998 - Munich Re

Create successful ePaper yourself
Turn your PDF publications into a flip-book with our unique Google optimized e-Paper software.
<strong>Munich</strong> <strong>Re</strong> <strong><strong>Re</strong>port</strong> of the Board of Management<br />
Pr. year<br />
Other Non-life non-life Pr. year<br />
Engineering classes combined Total combined total DM m<br />
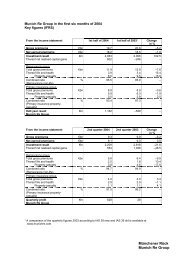
1,948 2,841 20,727 24,944 15,469 19,329 Gross premiums written<br />
1,716 2,583 18,186 21,715 13,575 16,775 Net premiums written<br />
1,748 2,570 18,216 21,739 13,435 16,549 Net premiums earned<br />
4 4 128 1,157 135 1,031 Interest on premium funds and provisions<br />
Claims incurred<br />
1,023 1,660 11,072 12,995 8,646 10,320 – Payments<br />
83 –122 1,399 1,418 374 406 – Change in provision<br />
1,106 1,538 12,471 14,413 9,020 10,726<br />
603 913 5,858 6,972 4,151 5,037 Operating expenses<br />
–44 –27 –16 –1,555 –165 –1,586 Other income and expenditure<br />
–1 96 –1 –44 234 231 Underwriting result<br />
Change in claims<br />
–136 –17 –1,226 –1,226 –1,203 –1,203 equalization provisions<br />
Underwriting result after change<br />
–137 79 –1,227 –1,270 –969 –972 in claims equalization provisions<br />
33<br />
Ratios in % – business year<br />
65.6 60.8 67.8 Loss ratio<br />
34.5 35.5 32.2 Expense ratio<br />
100.1 96.3 100.0 Combined ratio<br />
Ratios in % – previous year<br />
59.7 59.3 67.4 Loss ratio<br />
34.9 34.3 30.9 Expense ratio<br />
94.6 93.6 98.3 Combined ratio