Mechanics and Tribology of MEMS Materials - prod.sandia.gov ...
Mechanics and Tribology of MEMS Materials - prod.sandia.gov ...
Mechanics and Tribology of MEMS Materials - prod.sandia.gov ...

Create successful ePaper yourself
Turn your PDF publications into a flip-book with our unique Google optimized e-Paper software.
2 Strength Distributions in SUMMiT TM SMM Polysilicon<br />
2.1 Weibull Analysis <strong>of</strong> Strength Distributions in SUMMiT TM Polysilicon<br />
Monotonic, time-independent failure in brittle materials is typically driven by preexisting<br />
processing-induced flaws. In such a case, there is a statistical distribution <strong>of</strong> flaw sizes<br />
within the material, which results in a distribution in failure strengths. Such strength variability<br />
in brittle materials can <strong>of</strong>ten be described by the Weibull distribution. The two-parameter<br />
Weibull distribution can be expressed by the following probability density function (PDF):<br />
⎡ ⎛ σ ⎞<br />
P = 1−<br />
exp⎢−<br />
⎜<br />
⎟<br />
⎢⎣<br />
⎝σ<br />
θ ⎠<br />
where P represents the probability <strong>of</strong> failure, σ represents the applied stress, σθ, is the scale<br />
parameter <strong>of</strong>ten called the characteristic strength, <strong>and</strong> m is the shape parameter <strong>of</strong>ten called the<br />
Weibull modulus. By taking the natural logarithm <strong>of</strong> both sides <strong>of</strong> the previous equation twice, a<br />
linear relationship is established which can be used to evaluate data graphically:<br />
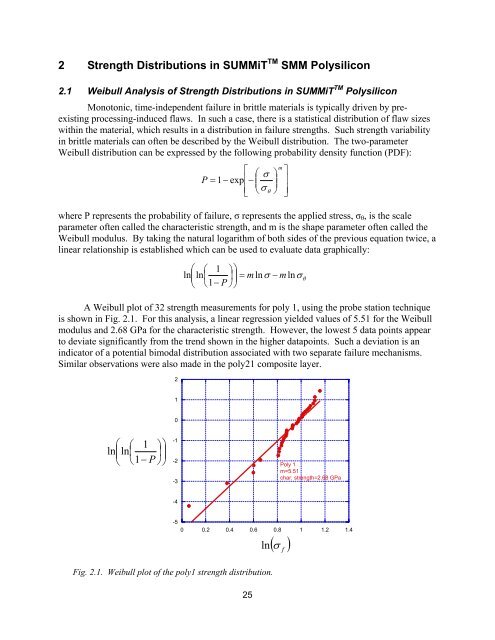
A Weibull plot <strong>of</strong> 32 strength measurements for poly 1, using the probe station technique<br />
is shown in Fig. 2.1. For this analysis, a linear regression yielded values <strong>of</strong> 5.51 for the Weibull<br />
modulus <strong>and</strong> 2.68 GPa for the characteristic strength. However, the lowest 5 data points appear<br />
to deviate significantly from the trend shown in the higher datapoints. Such a deviation is an<br />
indicator <strong>of</strong> a potential bimodal distribution associated with two separate failure mechanisms.<br />
Similar observations were also made in the poly21 composite layer.<br />
⎛ ⎛ 1 ⎞⎞<br />
ln⎜ln⎜<br />
⎟⎟<br />
⎝ ⎝1<br />
− P ⎠⎠<br />
Fig. 2.1. Weibull plot <strong>of</strong> the poly1 strength distribution.<br />
2<br />
1<br />
0<br />
-1<br />
-2<br />
-3<br />
-4<br />
25<br />
m<br />
⎤<br />
⎥<br />
⎥⎦<br />
⎛ ⎛ 1 ⎞⎞<br />
ln⎜ln⎜ ⎟⎟<br />
= mlnσ<br />
− mln<br />
⎝ ⎝1−<br />
P ⎠⎠<br />
ln(<br />
σ f )<br />
σθ<br />
Poly 1<br />
m=5.51<br />
char. strength=2.68 GPa<br />
-5<br />
0 0.2 0.4 0.6 0.8 1 1.2 1.4