Mechanics and Tribology of MEMS Materials - prod.sandia.gov ...
Mechanics and Tribology of MEMS Materials - prod.sandia.gov ...
Mechanics and Tribology of MEMS Materials - prod.sandia.gov ...

Create successful ePaper yourself
Turn your PDF publications into a flip-book with our unique Google optimized e-Paper software.
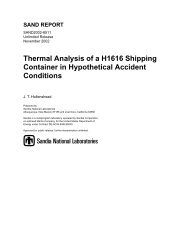
direction. Also, maximum stress locations are denser in regions where the grain sizes are<br />
smaller, simply because the density <strong>of</strong> boundary triple junctions is higher in these regions.<br />
These regions are near the bottom <strong>of</strong> the poly3 template <strong>and</strong> the bottom layer in the poly12<br />
template.<br />
Fig. 3.4. (a-b) Maximum stress locations from 100 simulations to 1% tensile strain. Each<br />
simulation used the same polycrystal templates with different crystallographic<br />
orientations assigned to the grains.<br />
The maximum stress values obtained from the 100 simulations to 1% strain are<br />
statistically distributed <strong>and</strong> can be plotted using a Weibull analysis, as described in the previous<br />
section. A large value <strong>of</strong> maximum local stress in a simulated polycrystal corresponds to a<br />
sample that would fail at a correspondingly small globally applied stress. Thus, to distribute the<br />
data for Weibull analysis in a manner comparable to the experimental results presented in the<br />
previous section, the maximum stress data is ranked in reverse order. By using the probability<br />
estimator, given in the previous section, then plotting the data against the natural log <strong>of</strong> the<br />
inverse <strong>of</strong> the maximum stress values, a Weibull plot comparable to the experimentally<br />
determined plots given in the previous sections is generated. Fig. 3.5 illustrates the plot.<br />
In Fig. 3.5 the poly12 distribution lies to the right <strong>of</strong> the poly3 distribution. This is caused<br />
by the presence <strong>of</strong> the interlayer boundary oriented parallel to the tensile direction in the poly12<br />
section. This boundary increases the number <strong>of</strong> critical flaws, slightly increasing the possibility<br />
<strong>of</strong> larger maximum stress values after 1% strain <strong>and</strong> shifting the poly12 distribution to the right<br />
in Fig. 3.5. This shift corresponds to a lower average global failure strength in the poly12<br />
ligaments. The spread <strong>of</strong> both distributions , which defines the Weibull modulus, is nearly<br />
indentical. Estimates <strong>of</strong> the Weibull modulus based on the plot in Fig. 3.5 are m ≈ 35, indicating<br />
37