Download the Annual report 2011 - Unisa
Download the Annual report 2011 - Unisa
Download the Annual report 2011 - Unisa

Create successful ePaper yourself
Turn your PDF publications into a flip-book with our unique Google optimized e-Paper software.
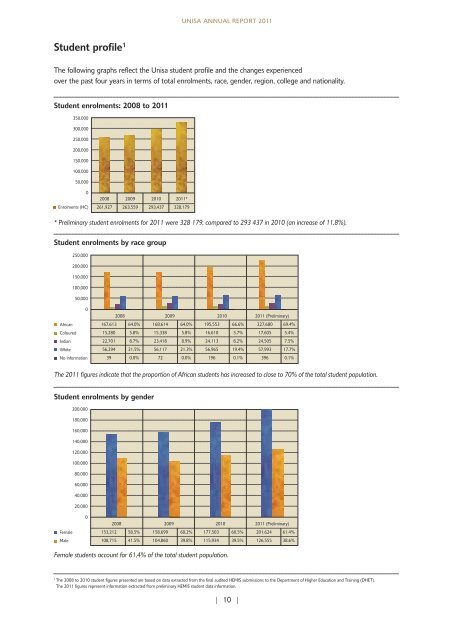
Student profile 1<br />
UNISA ANNUAL REPORT <strong>2011</strong><br />
The following graphs reflect <strong>the</strong> <strong>Unisa</strong> student profile and <strong>the</strong> changes experienced<br />
over <strong>the</strong> past four years in terms of total enrolments, race, gender, region, college and nationality.<br />
Student enrolments: 2008 to <strong>2011</strong><br />
350,000<br />
300,000<br />
250,000<br />
200,000<br />
150,000<br />
100,000<br />
50,000<br />
0<br />
Enrolments (HC)<br />
2008 2009 2010 <strong>2011</strong>*<br />
261,927 263,559 293,437 328,179<br />
* Preliminary student enrolments for <strong>2011</strong> were 328 179, compared to 293 437 in 2010 (an increase of 11,8%).<br />
Student enrolments by race group<br />
250,000<br />
200,000<br />
150,000<br />
100,000<br />
50,000<br />
0<br />
African<br />
Coloured<br />
Indian<br />
White<br />
No information<br />
2008 2009 2010 <strong>2011</strong> (Preliminary)<br />
167,613 64.0% 168,614 64.0% 195,553 66.6% 227,680 69.4%<br />
15,280 5.8% 15,338 5.8% 16,610 5.7% 17,605 5.4%<br />
22,701 8.7% 23,418 8.9% 24,113 8.2% 24,505 7.5%<br />
56,294 21.5% 56,117 21.3% 56,965 19.4% 57,993 17.7%<br />
39 0.0% 72 0.0% 196 0.1% 396 0.1%<br />
The <strong>2011</strong> figures indicate that <strong>the</strong> proportion of African students has increased to close to 70% of <strong>the</strong> total student population.<br />
Student enrolments by gender<br />
Female<br />
Male<br />
200,000<br />
180,000<br />
160,000<br />
140,000<br />
120,000<br />
100,000<br />
80,000<br />
60,000<br />
40,000<br />
20,000<br />
0<br />
2008 2009 2010 <strong>2011</strong> (Preliminary)<br />
153,212 58.5% 158.699 60.2% 177,503 60.5% 201.624 61.4%<br />
108,715 41.5% 104,860 39.8% 115,934 39.5% 126,555 38.6%<br />
Female students account for 61,4% of <strong>the</strong> total student population.<br />
1 The 2008 to 2010 student figures presented are based on data extracted from <strong>the</strong> final audited HEMIS submissions to <strong>the</strong> Department of Higher Education and Training (DHET).<br />
The <strong>2011</strong> figures represent information extracted from preliminary HEMIS student data information.<br />
| 10 |