Download the Annual report 2011 - Unisa
Download the Annual report 2011 - Unisa
Download the Annual report 2011 - Unisa

Create successful ePaper yourself
Turn your PDF publications into a flip-book with our unique Google optimized e-Paper software.
UNISA ANNUAL REPORT <strong>2011</strong><br />
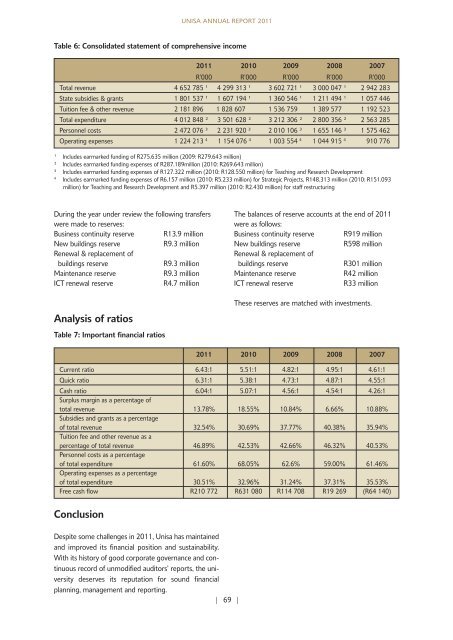
Table 6: Consolidated statement of comprehensive income<br />
¹ Includes earmarked funding of R275.635 million (2009: R279.643 million)<br />
² Includes earmarked funding expenses of R287.189million (2010: R269.643 million)<br />
³ Includes earmarked funding expenses of R127.322 million (2010: R128.550 million) for Teaching and Research Development<br />
4 Includes earmarked funding expenses of R6.157 million (2010: R5.233 million) for Strategic Projects, R148.313 million (2010: R151.093<br />
million) for Teaching and Research Development and R5.397 million (2010: R2.430 million) for staff restructuring<br />
During <strong>the</strong> year under review <strong>the</strong> following transfers<br />
were made to reserves:<br />
Business continuity reserve R13.9 million<br />
New buildings reserve R9.3 million<br />
Renewal & replacement of<br />
buildings reserve R9.3 million<br />
Maintenance reserve R9.3 million<br />
ICT renewal reserve R4.7 million<br />
<strong>2011</strong> 2010 2009 2008 2007<br />
R’000 R’000 R’000 R’000 R’000<br />
Total revenue 4 652 785 ¹ 4 299 313 ¹ 3 602 721 ¹ 3 000 047 ¹ 2 942 283<br />
State subsidies & grants 1 801 537 ¹ 1 607 194 ¹ 1 360 546 ¹ 1 211 494 ¹ 1 057 446<br />
Tuition fee & o<strong>the</strong>r revenue 2 181 896 1 828 607 1 536 759 1 389 577 1 192 523<br />
Total expenditure 4 012 848 ² 3 501 628 ² 3 212 306 ² 2 800 356 ² 2 563 285<br />
Personnel costs 2 472 076 ³ 2 231 920 ³ 2 010 106 ³ 1 655 146 ³ 1 575 462<br />
Operating expenses 1 224 213 4 1 154 076 4 1 003 554 4 1 044 915 4 910 776<br />
Analysis of ratios<br />
Table 7: Important financial ratios<br />
Conclusion<br />
Despite some challenges in <strong>2011</strong>, <strong>Unisa</strong> has maintained<br />
and improved its financial position and sustainability.<br />
With its history of good corporate governance and continuous<br />
record of unmodified auditors’ <strong>report</strong>s, <strong>the</strong> university<br />
deserves its reputation for sound financial<br />
planning, management and <strong>report</strong>ing.<br />
| 69 |<br />
The balances of reserve accounts at <strong>the</strong> end of <strong>2011</strong><br />
were as follows:<br />
Business continuity reserve R919 million<br />
New buildings reserve R598 million<br />
Renewal & replacement of<br />
buildings reserve R301 million<br />
Maintenance reserve R42 million<br />
ICT renewal reserve R33 million<br />
These reserves are matched with investments.<br />
<strong>2011</strong> 2010 2009 2008 2007<br />
Current ratio 6.43:1 5.51:1 4.82:1 4.95:1 4.61:1<br />
Quick ratio 6.31:1 5.38:1 4.73:1 4.87:1 4.55:1<br />
Cash ratio<br />
Surplus margin as a percentage of<br />
6.04:1 5.07:1 4.56:1 4.54:1 4.26:1<br />
total revenue<br />
Subsidies and grants as a percentage<br />
13.78% 18.55% 10.84% 6.66% 10.88%<br />
of total revenue<br />
Tuition fee and o<strong>the</strong>r revenue as a<br />
32.54% 30.69% 37.77% 40.38% 35.94%<br />
percentage of total revenue<br />
Personnel costs as a percentage<br />
46.89% 42.53% 42.66% 46.32% 40.53%<br />
of total expenditure<br />
Operating expenses as a percentage<br />
61.60% 68.05% 62.6% 59.00% 61.46%<br />
of total expenditure 30.51% 32.96% 31.24% 37.31% 35.53%<br />
Free cash flow R210 772 R631 080 R114 708 R19 269 (R64 140)