Download the Annual report 2011 - Unisa
Download the Annual report 2011 - Unisa
Download the Annual report 2011 - Unisa

You also want an ePaper? Increase the reach of your titles
YUMPU automatically turns print PDFs into web optimized ePapers that Google loves.
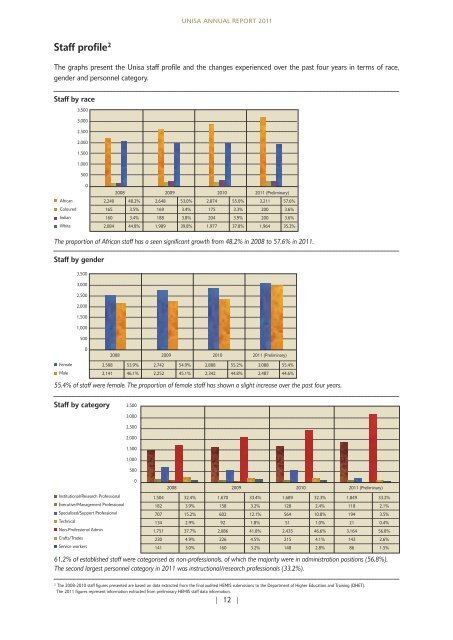
Staff profile 2<br />
The graphs present <strong>the</strong> <strong>Unisa</strong> staff profile and <strong>the</strong> changes experienced over <strong>the</strong> past four years in terms of race,<br />
gender and personnel category.<br />
Staff by race<br />
African<br />
Coloured<br />
Indian<br />
White<br />
3,500<br />
3,000<br />
2,500<br />
2,000<br />
1,500<br />
1,000<br />
500<br />
The proportion of African staff has a seen significant growth from 48,2% in 2008 to 57,6% in <strong>2011</strong>.<br />
Staff by gender<br />
Female<br />
Male<br />
55,4% of staff were female. The proportion of female staff has shown a slight increase over <strong>the</strong> past four years.<br />
Staff by category<br />
0<br />
3,500<br />
3,000<br />
2,500<br />
2,000<br />
1,500<br />
1,000<br />
500<br />
0<br />
Institutional/Research Professional<br />
Executive/Management Professional<br />
Specialised/Support Professional<br />
Technical<br />
Non-Professional Admin<br />
Crafts/Trades<br />
Service workers<br />
UNISA ANNUAL REPORT <strong>2011</strong><br />
2008 2009 2010 <strong>2011</strong> (Preliminary)<br />
2,240 48.2% 2,648 53.0% 2,874 55.0% 3,211 57.6%<br />
165 3.5% 169 3.4% 175 3.3% 200 3.6%<br />
160 3.4% 188 3.8% 204 3.9% 200 3.6%<br />
2,084 44.8% 1,989 39.8% 1,977 37.8% 1,964 35.2%<br />
2008 2009 2010 <strong>2011</strong> (Preliminary)<br />
2,508 53.9% 2,742 54.9% 2,888 55.2% 3,088 55.4%<br />
2,141 46.1% 2,252 45.1% 2,342 44.8% 2,487 44.6%<br />
3,500<br />
3,000<br />
2,500<br />
2,000<br />
1,500<br />
1,000<br />
500<br />
0<br />
2008 2009 2010 <strong>2011</strong> (Preliminary)<br />
1,504 32.4% 1,670 33.4% 1,689 32.3% 1,849 33.2%<br />
182 3.9% 158 3.2% 128 2.4% 118 2.1%<br />
707 15.2% 602 12.1% 564 10.8% 194 3.5%<br />
134 2.9% 92 1.8% 51 1.0% 21 0.4%<br />
1,751 37.7% 2,086 41.8% 2,435 46.6% 3,164 56.8%<br />
230 4.9% 226 4.5% 215 4.1% 143 2.6%<br />
141 3.0% 160 3.2% 148 2.8% 86 1.5%<br />
61,2% of established staff were categorised as non-professionals, of which <strong>the</strong> majority were in administration positions (56,8%).<br />
The second largest personnel category in <strong>2011</strong> was instructional/research professionals (33,2%).<br />
2 The 2008-2010 staff figures presented are based on data extracted from <strong>the</strong> final audited HEMIS submissions to <strong>the</strong> Department of Higher Education and Training (DHET).<br />
The <strong>2011</strong> figures represent information extracted from preliminary HEMIS staff data information.<br />
| 12 |