Mireille Falardeau et Michel Loranger Le choix de stratégies ... - CSSE
Mireille Falardeau et Michel Loranger Le choix de stratégies ... - CSSE
Mireille Falardeau et Michel Loranger Le choix de stratégies ... - CSSE

You also want an ePaper? Increase the reach of your titles
YUMPU automatically turns print PDFs into web optimized ePapers that Google loves.
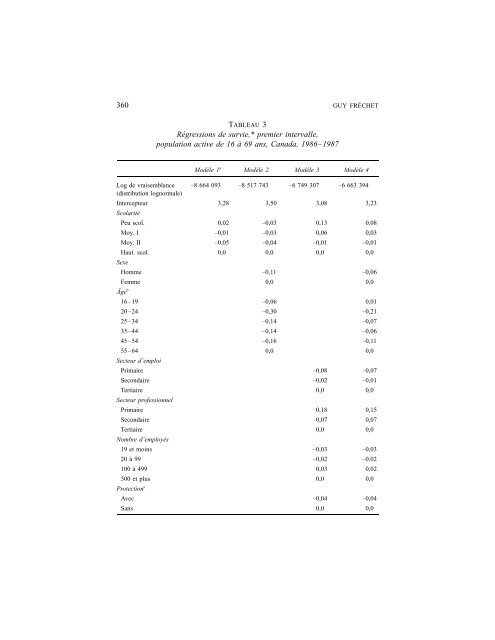
360 GUY FRÉCHET<br />
TABLEAU 3<br />
Régressions <strong>de</strong> survie,* premier intervalle,<br />
population active <strong>de</strong> 16 à 69 ans, Canada, 1986–1987<br />
Modèle 1 a<br />
Modèle 2 Modèle 3 Modèle 4<br />
Log <strong>de</strong> vraisemblance<br />
(distribution lognormale)<br />
–8 664 093 –8 517 743 –6 749 307 –6 663 394<br />
Intercepteur<br />
Scolarité<br />
3,28 3,50 3,08 3,23<br />
Peu scol. 0,02 –0,03 0,13 0,08<br />
Moy. I –0,01 –0,03 0,06 0,03<br />
Moy. II –0,05 –0,04 –0,01 –0,01<br />
Haut. scol.<br />
Sexe<br />
0,0 0,0 0,0 0,0<br />
Homme –0,11 –0,06<br />
Femme 0,0 0,0<br />
Âge b<br />
16–19 –0,06 0,01<br />
20–24 –0,30 –0,21<br />
25–34 –0,14 –0,07<br />
35–44 –0,14 –0,06<br />
45–54 –0,16 –0,11<br />
55–64<br />
Secteur d’emploi<br />
0,0 0,0<br />
Primaire –0,08 –0,07<br />
Secondaire –0,02 –0,01<br />
Tertiaire<br />
Secteur professionnel<br />
0,0 0,0<br />
Primaire 0,18 0,15<br />
Secondaire 0,07 0,07<br />
Tertiaire<br />
Nombre d’employés<br />
0,0 0,0<br />
19 <strong>et</strong> moins –0,03 –0,03<br />
20 à 99 –0,02 –0,02<br />
100 à 499 0,03 0,02<br />
500 <strong>et</strong> plus 0,0 0,0<br />
Protection c<br />
Avec –0,04 –0,04<br />
Sans 0,0 0,0