constituent assembly of india debates (proceedings)- volume vii
constituent assembly of india debates (proceedings)- volume vii
constituent assembly of india debates (proceedings)- volume vii

Create successful ePaper yourself
Turn your PDF publications into a flip-book with our unique Google optimized e-Paper software.
[Annexure V]<br />
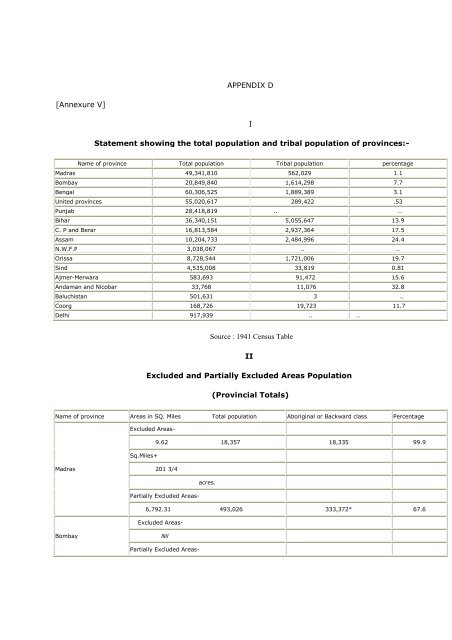
APPENDIX D<br />
I<br />
Statement showing the total population and tribal population <strong>of</strong> provinces:-<br />
Name <strong>of</strong> province Total population Tribal population percentage<br />
Madras 49,341,810 562,029 1.1<br />
Bombay 20,849,840 1,614,298 7.7<br />
Bengal 60,306,525 1,889,389 3.1<br />
United provinces 55,020,617 289,422 .53<br />
Punjab 28,418,819 .. ..<br />
Bihar 36,340,151 5,055,647 13.9<br />
C. P and Berar 16,813,584 2,937,364 17.5<br />
Assam 10,204,733 2,484,996 24.4<br />
N.W.F.P 3,038,067 .. ..<br />
Orissa 8,728,544 1,721,006 19.7<br />
Sind 4,535,008 33,819 0.81<br />
Ajmer-Merwara 583,693 91,472 15.6<br />
Andaman and Nicobar 33,768 11,076 32.8<br />
Baluchistan 501,631 3 ..<br />
Coorg 168,726 19,723 11.7<br />
Delhi 917,939 .. ..<br />
Source : 1941 Census Table<br />
II<br />
Excluded and Partially Excluded Areas Population<br />
(Provincial Totals)<br />
Name <strong>of</strong> province Areas in SQ. Miles Total population Aboriginal or Backward class Percentage<br />
Madras<br />
Bombay<br />
Excluded Areas-<br />
Sq.Miles+<br />
9.62 18,357 18,335 99.9<br />
201 3/4<br />
Partially Excluded Areas-<br />
acres.<br />
6,792.31 493,026 333,372* 67.6<br />
Excluded Areas-<br />
Nil<br />
Partially Excluded Areas-
![gÉÉŌ A.]ÉŌ. xÉÉxÉÉ](https://img.yumpu.com/8015720/1/190x245/geeo-aeo-xeexee.jpg?quality=85)