Impact of Drivetrain on Wind Farm VAR Control - Upwind
Impact of Drivetrain on Wind Farm VAR Control - Upwind
Impact of Drivetrain on Wind Farm VAR Control - Upwind

You also want an ePaper? Increase the reach of your titles
YUMPU automatically turns print PDFs into web optimized ePapers that Google loves.
UPWIND<br />
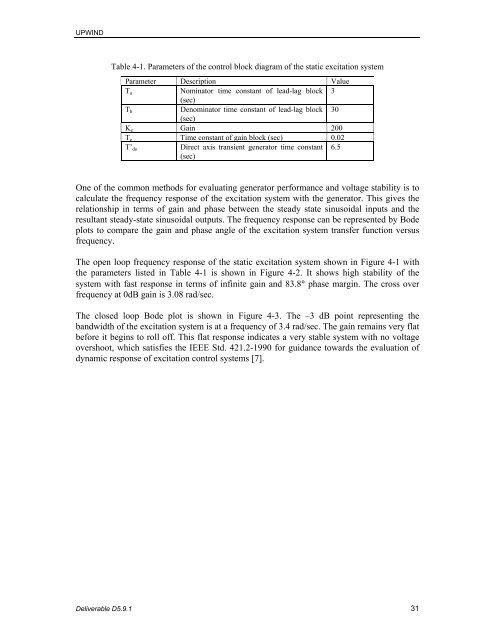
Table 4-1. Parameters <str<strong>on</strong>g>of</str<strong>on</strong>g> the c<strong>on</strong>trol block diagram <str<strong>on</strong>g>of</str<strong>on</strong>g> the static excitati<strong>on</strong> system<br />
Parameter Descripti<strong>on</strong> Value<br />
Ta<br />
Nominator time c<strong>on</strong>stant <str<strong>on</strong>g>of</str<strong>on</strong>g> lead-lag block<br />
(sec)<br />
3<br />
Tb<br />
Denominator time c<strong>on</strong>stant <str<strong>on</strong>g>of</str<strong>on</strong>g> lead-lag block<br />
(sec)<br />
30<br />
Ke Gain 200<br />
Te Time c<strong>on</strong>stant <str<strong>on</strong>g>of</str<strong>on</strong>g> gain block (sec) 0.02<br />
T’do<br />
Direct axis transient generator time c<strong>on</strong>stant<br />
(sec)<br />
6.5<br />
One <str<strong>on</strong>g>of</str<strong>on</strong>g> the comm<strong>on</strong> methods for evaluating generator performance and voltage stability is to<br />
calculate the frequency resp<strong>on</strong>se <str<strong>on</strong>g>of</str<strong>on</strong>g> the excitati<strong>on</strong> system with the generator. This gives the<br />
relati<strong>on</strong>ship in terms <str<strong>on</strong>g>of</str<strong>on</strong>g> gain and phase between the steady state sinusoidal inputs and the<br />
resultant steady-state sinusoidal outputs. The frequency resp<strong>on</strong>se can be represented by Bode<br />
plots to compare the gain and phase angle <str<strong>on</strong>g>of</str<strong>on</strong>g> the excitati<strong>on</strong> system transfer functi<strong>on</strong> versus<br />
frequency.<br />
The open loop frequency resp<strong>on</strong>se <str<strong>on</strong>g>of</str<strong>on</strong>g> the static excitati<strong>on</strong> system shown in Figure 4-1 with<br />
the parameters listed in Table 4-1 is shown in Figure 4-2. It shows high stability <str<strong>on</strong>g>of</str<strong>on</strong>g> the<br />
system with fast resp<strong>on</strong>se in terms <str<strong>on</strong>g>of</str<strong>on</strong>g> infinite gain and 83.8° phase margin. The cross over<br />
frequency at 0dB gain is 3.08 rad/sec.<br />
The closed loop Bode plot is shown in Figure 4-3. The –3 dB point representing the<br />
bandwidth <str<strong>on</strong>g>of</str<strong>on</strong>g> the excitati<strong>on</strong> system is at a frequency <str<strong>on</strong>g>of</str<strong>on</strong>g> 3.4 rad/sec. The gain remains very flat<br />
before it begins to roll <str<strong>on</strong>g>of</str<strong>on</strong>g>f. This flat resp<strong>on</strong>se indicates a very stable system with no voltage<br />
overshoot, which satisfies the IEEE Std. 421.2-1990 for guidance towards the evaluati<strong>on</strong> <str<strong>on</strong>g>of</str<strong>on</strong>g><br />
dynamic resp<strong>on</strong>se <str<strong>on</strong>g>of</str<strong>on</strong>g> excitati<strong>on</strong> c<strong>on</strong>trol systems [7].<br />
Deliverable D5.9.1 31