Impact of Drivetrain on Wind Farm VAR Control - Upwind
Impact of Drivetrain on Wind Farm VAR Control - Upwind
Impact of Drivetrain on Wind Farm VAR Control - Upwind

You also want an ePaper? Increase the reach of your titles
YUMPU automatically turns print PDFs into web optimized ePapers that Google loves.
UPWIND<br />
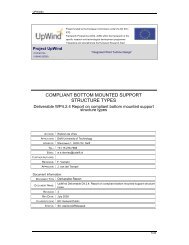
Magnitude (dB)<br />
Phase (deg)<br />
20<br />
10<br />
0<br />
-10<br />
-20<br />
-30<br />
-40<br />
-50<br />
-60<br />
-70<br />
-80<br />
0<br />
-45<br />
-90<br />
-135<br />
10 -2<br />
-180<br />
10 -1<br />
10 0<br />
Bode Diagram<br />
Frequency (rad/sec)<br />
Figure 4-3. Closed loop Bode diagram <str<strong>on</strong>g>of</str<strong>on</strong>g> the static excitati<strong>on</strong> system.<br />
The excitati<strong>on</strong> system performance was examined by switching a capacitive load impedance<br />
at the POI at Bus 1 <str<strong>on</strong>g>of</str<strong>on</strong>g> the c<strong>on</strong>sidered test system in this report. This was performed with<br />
different system SCRs. The capacitive impedances were 0.5, 2 and 3.5 pu based <strong>on</strong> an<br />
arbitrary 100 MVA base with system SCRs <str<strong>on</strong>g>of</str<strong>on</strong>g> 20, 5, and 3 respectively to have almost the<br />
same step voltage change at the POI, and at the same time having the excitati<strong>on</strong> system<br />
operating within the limits <str<strong>on</strong>g>of</str<strong>on</strong>g> its field voltage. Two different cases <str<strong>on</strong>g>of</str<strong>on</strong>g> wind farm power levels<br />
were c<strong>on</strong>sidered. The first <strong>on</strong>e was full power with all WTGs in service, and the sec<strong>on</strong>d <strong>on</strong>e<br />
was half power with half <str<strong>on</strong>g>of</str<strong>on</strong>g> the WTGs in service. The system resp<strong>on</strong>se is shown in Figure 4-4<br />
for full power and in Figure 4-5 for the half power case. The left plots depict the WTG<br />
terminal voltage (blue line) and field voltage (red line) as well as the POI voltage (green<br />
line). The right plots show the WTG active (blue line) and reactive power (red line).<br />
It can be inferred how the excitati<strong>on</strong> system could provide a smooth resp<strong>on</strong>se in regulating<br />
the WTG terminal voltage with a rough time c<strong>on</strong>stant <str<strong>on</strong>g>of</str<strong>on</strong>g> 2 sec<strong>on</strong>ds for system SCR <str<strong>on</strong>g>of</str<strong>on</strong>g> 20 and<br />
about 1 sec<strong>on</strong>d for systems SCRs <str<strong>on</strong>g>of</str<strong>on</strong>g> 5 and 3. With half <str<strong>on</strong>g>of</str<strong>on</strong>g> the WTGs in service, the excitati<strong>on</strong><br />
time resp<strong>on</strong>se is a little bit l<strong>on</strong>ger than that in the case with all WTGs in service. However,<br />
the difference is not noticeable. This shows that the system SCR has a more pr<strong>on</strong>ounced<br />
impact <strong>on</strong> the excitati<strong>on</strong> system than that due to the number <str<strong>on</strong>g>of</str<strong>on</strong>g> c<strong>on</strong>nected WTGs.<br />
Deliverable D5.9.1 33<br />
10 1<br />
10 2<br />
10 3