Annual Report 2008 - Securitas
Annual Report 2008 - Securitas
Annual Report 2008 - Securitas
Create successful ePaper yourself
Turn your PDF publications into a flip-book with our unique Google optimized e-Paper software.
138<br />
Five year summary and quarterly data<br />
quarterly data<br />
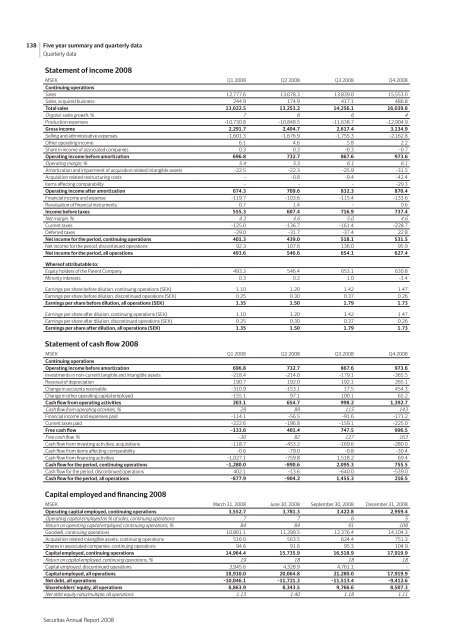
Statement of income <strong>2008</strong><br />
MSEK q1 <strong>2008</strong> q2 <strong>2008</strong> q3 <strong>2008</strong> q4 <strong>2008</strong><br />
Continuing operations<br />
Sales 12,777.6 13,078.3 13,839.0 15,553.0<br />
Sales, acquired business 244.9 174.9 417.1 486.8<br />
Total sales 13,022.5 13,253.2 14,256.1 16,039.8<br />
Organic sales growth, % 7 6 6 4<br />
Production expenses –10,730.8 –10,848.5 –11,638.7 –12,904.9<br />
Gross income 2,291.7 2,404.7 2,617.4 3,134.9<br />
Selling and administrative expenses –1,601.3 –1,676.9 –1,755.3 –2,162.8<br />
Other operating income 6.1 4.6 5.8 2.2<br />
Share in income of associated companies 0.3 0.3 –0.3 –0.7<br />
Operating income before amortization 696.8 732.7 867.6 973.6<br />
Operating margin, % 5.4 5.5 6.1 6.1<br />
Amortization and impairment of acquisition related intangible assets –22.5 –22.3 –25.9 –31.5<br />
Acquisition related restructuring costs – –0.8 –9.4 –42.4<br />
Items affecting comparability – – – –29.3<br />
Operating income after amortization 674.3 709.6 832.3 870.4<br />
Financial income and expense –119.7 –103.6 –115.4 –133.6<br />
Revaluation of financial instruments 0.7 1.4 – 0.6<br />
Income before taxes 555.3 607.4 716.9 737.4<br />
Net margin, % 4.3 4.6 5.0 4.6<br />
current taxes –125.0 –136.7 –161.4 –228.7<br />
Deferred taxes –29.0 –31.7 –37.4 22.8<br />
Net income for the period, continuing operations 401.3 439.0 518.1 531.5<br />
Net income for the period, discontinued operations 92.3 107.6 136.0 95.9<br />
Net income for the period, all operations 493.6 546.6 654.1 627.4<br />
Whereof attributable to:<br />
Equity holders of the Parent company 493.3 546.4 653.1 630.8<br />
Minority interests 0.3 0.2 1.0 –3.4<br />
Earnings per share before dilution, continuing operations (SEK) 1.10 1.20 1.42 1.47<br />
Earnings per share before dilution, discontinued operations (SEK) 0.25 0.30 0.37 0.26<br />
Earnings per share before dilution, all operations (SEK) 1.35 1.50 1.79 1.73<br />
Earnings per share after dilution, continuing operations (SEK) 1.10 1.20 1.42 1.47<br />
Earnings per share after dilution, discontinued operations (SEK) 0.25 0.30 0.37 0.26<br />
Earnings per share after dilution, all operations (SEK) 1.35 1.50 1.79 1.73<br />
Statement of cash flow <strong>2008</strong><br />
MSEK q1 <strong>2008</strong> q2 <strong>2008</strong> q3 <strong>2008</strong> q4 <strong>2008</strong><br />
Continuing operations<br />
Operating income before amortization 696.8 732.7 867.6 973.6<br />
Investments in non-current tangible and intangible assets –218.4 –214.0 –179.1 –365.5<br />
reversal of depreciation 190.7 192.0 192.1 265.1<br />
change in accounts receivable –310.9 –153.1 17.5 454.3<br />
change in other operating capital employed –155.1 97.1 100.1 65.2<br />
Cash flow from operating activities 203.1 654.7 998.2 1,392.7<br />
Cash flow from operating activities, % 29 89 115 143<br />
Financial income and expenses paid –114.1 –56.5 –91.6 –171.2<br />
current taxes paid –222.6 –196.8 –159.1 –225.0<br />
Free cash flow –133.6 401.4 747.5 996.5<br />
Free cash flow, % –30 82 127 163<br />
Cash flow from investing activities, acquisitions –118.7 –453.2 –169.6 –280.0<br />
Cash flow from items affecting comparability –0.6 –79.0 –0.8 –30.4<br />
Cash flow from financing activities –1,027.1 –759.8 1,518.2 69.4<br />
Cash flow for the period, continuing operations –1,280.0 –890.6 2,095.3 755.5<br />
Cash flow for the period, discontinued operations 402.1 –13.6 –640.0 –539.0<br />
Cash flow for the period, all operations –877.9 –904.2 1,455.3 216.5<br />
Capital employed and financing <strong>2008</strong><br />
MSEK March 31, <strong>2008</strong> June 30, <strong>2008</strong> September 30, <strong>2008</strong> December 31, <strong>2008</strong><br />
Operating capital employed, continuing operations 3,552.7 3,781.3 3,422.8 2,959.4<br />
Operating capital employed as % of sales, continuing operations 7 7 6 5<br />
Return on operating capital employed, continuing operations, % 84 84 91 108<br />
Goodwill, continuing operations 10,801.1 11,299.5 12,376.4 14,104.3<br />
Acquisition related intangible assets, continuing operations 516.0 563.5 624.4 751.3<br />
Shares in associated companies, continuing operations 94.6 91.6 95.3 104.9<br />
Capital employed, continuing operations 14,964.4 15,735.9 16,518.9 17,919.9<br />
Return on capital employed, continuing operations, % 19 18 18 18<br />
capital employed, discontinued operations 3,945.6 4,328.9 4,761.1 –<br />
Capital employed, all operations 18,910.0 20,064.8 21,280.0 17,919.9<br />
Net debt, all operations –10,046.1 –11,721.3 –11,513.4 –9,412.6<br />
Shareholders’ equity, all operations 8,863.9 8,343.5 9,766.6 8,507.3<br />
Net debt equity ratio/multiple, all operations 1.13 1.40 1.18 1.11<br />
<strong>Securitas</strong> <strong>Annual</strong> report <strong>2008</strong>


