Introduction to Stata 8 - (GRIPS
Introduction to Stata 8 - (GRIPS
Introduction to Stata 8 - (GRIPS

You also want an ePaper? Increase the reach of your titles
YUMPU automatically turns print PDFs into web optimized ePapers that Google loves.
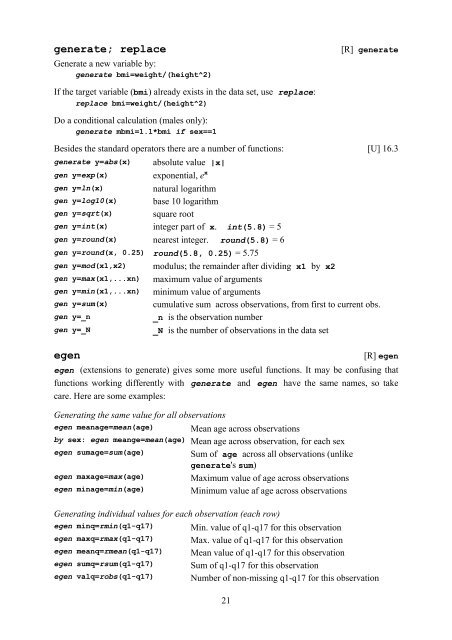
generate; replace [R] generate<br />
Generate a new variable by:<br />
generate bmi=weight/(height^2)<br />
If the target variable (bmi) already exists in the data set, use replace:<br />
replace bmi=weight/(height^2)<br />
Do a conditional calculation (males only):<br />
generate mbmi=1.1*bmi if sex==1<br />
Besides the standard opera<strong>to</strong>rs there are a number of functions: [U] 16.3<br />
generate y=abs(x) absolute value |x|<br />
gen y=exp(x) exponential, e x<br />
gen y=ln(x) natural logarithm<br />
gen y=log10(x) base 10 logarithm<br />
gen y=sqrt(x) square root<br />
gen y=int(x) integer part of x. int(5.8) = 5<br />
gen y=round(x) nearest integer. round(5.8) = 6<br />
gen y=round(x, 0.25) round(5.8, 0.25) = 5.75<br />
gen y=mod(x1,x2) modulus; the remainder after dividing x1 by x2<br />
gen y=max(x1,...xn) maximum value of arguments<br />
gen y=min(x1,...xn) minimum value of arguments<br />
gen y=sum(x) cumulative sum across observations, from first <strong>to</strong> current obs.<br />
gen y=_n _n is the observation number<br />
gen y=_N _N is the number of observations in the data set<br />
egen [R] egen<br />
egen (extensions <strong>to</strong> generate) gives some more useful functions. It may be confusing that<br />
functions working differently with generate and egen have the same names, so take<br />
care. Here are some examples:<br />
Generating the same value for all observations<br />
egen meanage=mean(age) Mean age across observations<br />
by sex: egen meange=mean(age) Mean age across observation, for each sex<br />
egen sumage=sum(age) Sum of age across all observations (unlike<br />
generate's sum)<br />
egen maxage=max(age) Maximum value of age across observations<br />
egen minage=min(age) Minimum value af age across observations<br />
Generating individual values for each observation (each row)<br />
egen minq=rmin(q1-q17) Min. value of q1-q17 for this observation<br />
egen maxq=rmax(q1-q17) Max. value of q1-q17 for this observation<br />
egen meanq=rmean(q1-q17) Mean value of q1-q17 for this observation<br />
egen sumq=rsum(q1-q17) Sum of q1-q17 for this observation<br />
egen valq=robs(q1-q17) Number of non-missing q1-q17 for this observation<br />
21