Introduction to Stata 8 - (GRIPS
Introduction to Stata 8 - (GRIPS
Introduction to Stata 8 - (GRIPS

You also want an ePaper? Increase the reach of your titles
YUMPU automatically turns print PDFs into web optimized ePapers that Google loves.
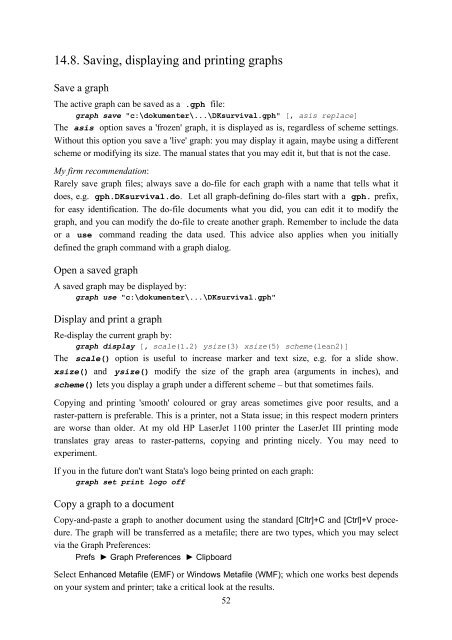
14.8. Saving, displaying and printing graphs<br />
Save a graph<br />
The active graph can be saved as a .gph file:<br />
graph save "c:\dokumenter\...\DKsurvival.gph" [, asis replace]<br />
The asis option saves a 'frozen' graph, it is displayed as is, regardless of scheme settings.<br />
Without this option you save a 'live' graph: you may display it again, maybe using a different<br />
scheme or modifying its size. The manual states that you may edit it, but that is not the case.<br />
My firm recommendation:<br />
Rarely save graph files; always save a do-file for each graph with a name that tells what it<br />
does, e.g. gph.DKsurvival.do. Let all graph-defining do-files start with a gph. prefix,<br />
for easy identification. The do-file documents what you did, you can edit it <strong>to</strong> modify the<br />
graph, and you can modify the do-file <strong>to</strong> create another graph. Remember <strong>to</strong> include the data<br />
or a use command reading the data used. This advice also applies when you initially<br />
defined the graph command with a graph dialog.<br />
Open a saved graph<br />
A saved graph may be displayed by:<br />
graph use "c:\dokumenter\...\DKsurvival.gph"<br />
Display and print a graph<br />
Re-display the current graph by:<br />
graph display [, scale(1.2) ysize(3) xsize(5) scheme(lean2)]<br />
The scale() option is useful <strong>to</strong> increase marker and text size, e.g. for a slide show.<br />
xsize() and ysize() modify the size of the graph area (arguments in inches), and<br />
scheme() lets you display a graph under a different scheme – but that sometimes fails.<br />
Copying and printing 'smooth' coloured or gray areas sometimes give poor results, and a<br />
raster-pattern is preferable. This is a printer, not a <strong>Stata</strong> issue; in this respect modern printers<br />
are worse than older. At my old HP LaserJet 1100 printer the LaserJet III printing mode<br />
translates gray areas <strong>to</strong> raster-patterns, copying and printing nicely. You may need <strong>to</strong><br />
experiment.<br />
If you in the future don't want <strong>Stata</strong>'s logo being printed on each graph:<br />
graph set print logo off<br />
Copy a graph <strong>to</strong> a document<br />
Copy-and-paste a graph <strong>to</strong> another document using the standard [Cltr]+C and [Ctrl]+V procedure.<br />
The graph will be transferred as a metafile; there are two types, which you may select<br />
via the Graph Preferences:<br />
Prefs ► Graph Preferences ► Clipboard<br />
Select Enhanced Metafile (EMF) or Windows Metafile (WMF); which one works best depends<br />
on your system and printer; take a critical look at the results.<br />
52