Introduction to Stata 8 - (GRIPS
Introduction to Stata 8 - (GRIPS
Introduction to Stata 8 - (GRIPS

You also want an ePaper? Increase the reach of your titles
YUMPU automatically turns print PDFs into web optimized ePapers that Google loves.
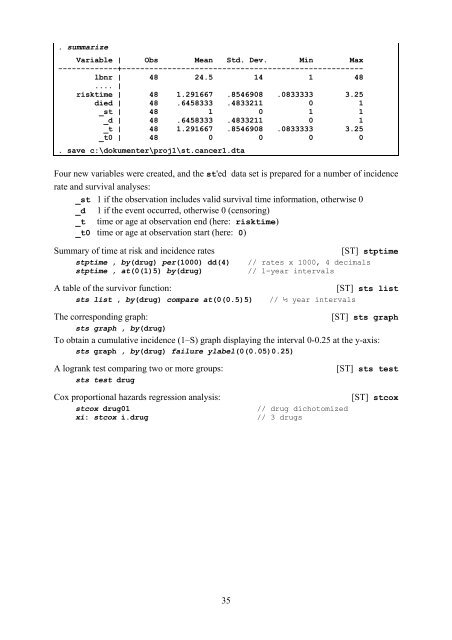
. summarize<br />
Variable | Obs Mean Std. Dev. Min Max<br />
-------------+-----------------------------------------------------<br />
lbnr | 48 24.5 14 1 48<br />
.... |<br />
risktime | 48 1.291667 .8546908 .0833333 3.25<br />
died | 48 .6458333 .4833211 0 1<br />
_st | 48 1 0 1 1<br />
_d | 48 .6458333 .4833211 0 1<br />
_t | 48 1.291667 .8546908 .0833333 3.25<br />
_t0 | 48 0 0 0 0<br />
. save c:\dokumenter\proj1\st.cancer1.dta<br />
Four new variables were created, and the st'ed data set is prepared for a number of incidence<br />
rate and survival analyses:<br />
_st 1 if the observation includes valid survival time information, otherwise 0<br />
_d 1 if the event occurred, otherwise 0 (censoring)<br />
_t time or age at observation end (here: risktime)<br />
_t0 time or age at observation start (here: 0)<br />
Summary of time at risk and incidence rates [ST] stptime<br />
stptime , by(drug) per(1000) dd(4) // rates x 1000, 4 decimals<br />
stptime , at(0(1)5) by(drug) // 1-year intervals<br />
A table of the survivor function: [ST] sts list<br />
sts list , by(drug) compare at(0(0.5)5) // ½ year intervals<br />
The corresponding graph: [ST] sts graph<br />
sts graph , by(drug)<br />
To obtain a cumulative incidence (1–S) graph displaying the interval 0-0.25 at the y-axis:<br />
sts graph , by(drug) failure ylabel(0(0.05)0.25)<br />
A logrank test comparing two or more groups: [ST] sts test<br />
sts test drug<br />
Cox proportional hazards regression analysis: [ST] stcox<br />
stcox drug01 // drug dicho<strong>to</strong>mized<br />
xi: stcox i.drug // 3 drugs<br />
35